Dashboard Overview

Create a New Report

To create a new report, follow the instructions below.

  1. From the left navigation panel, select Performance Reports and click New Report.
  2. Name your report and select the frequency of report generation (never, daily, weekly, and monthly) from the Repeat drop-down.
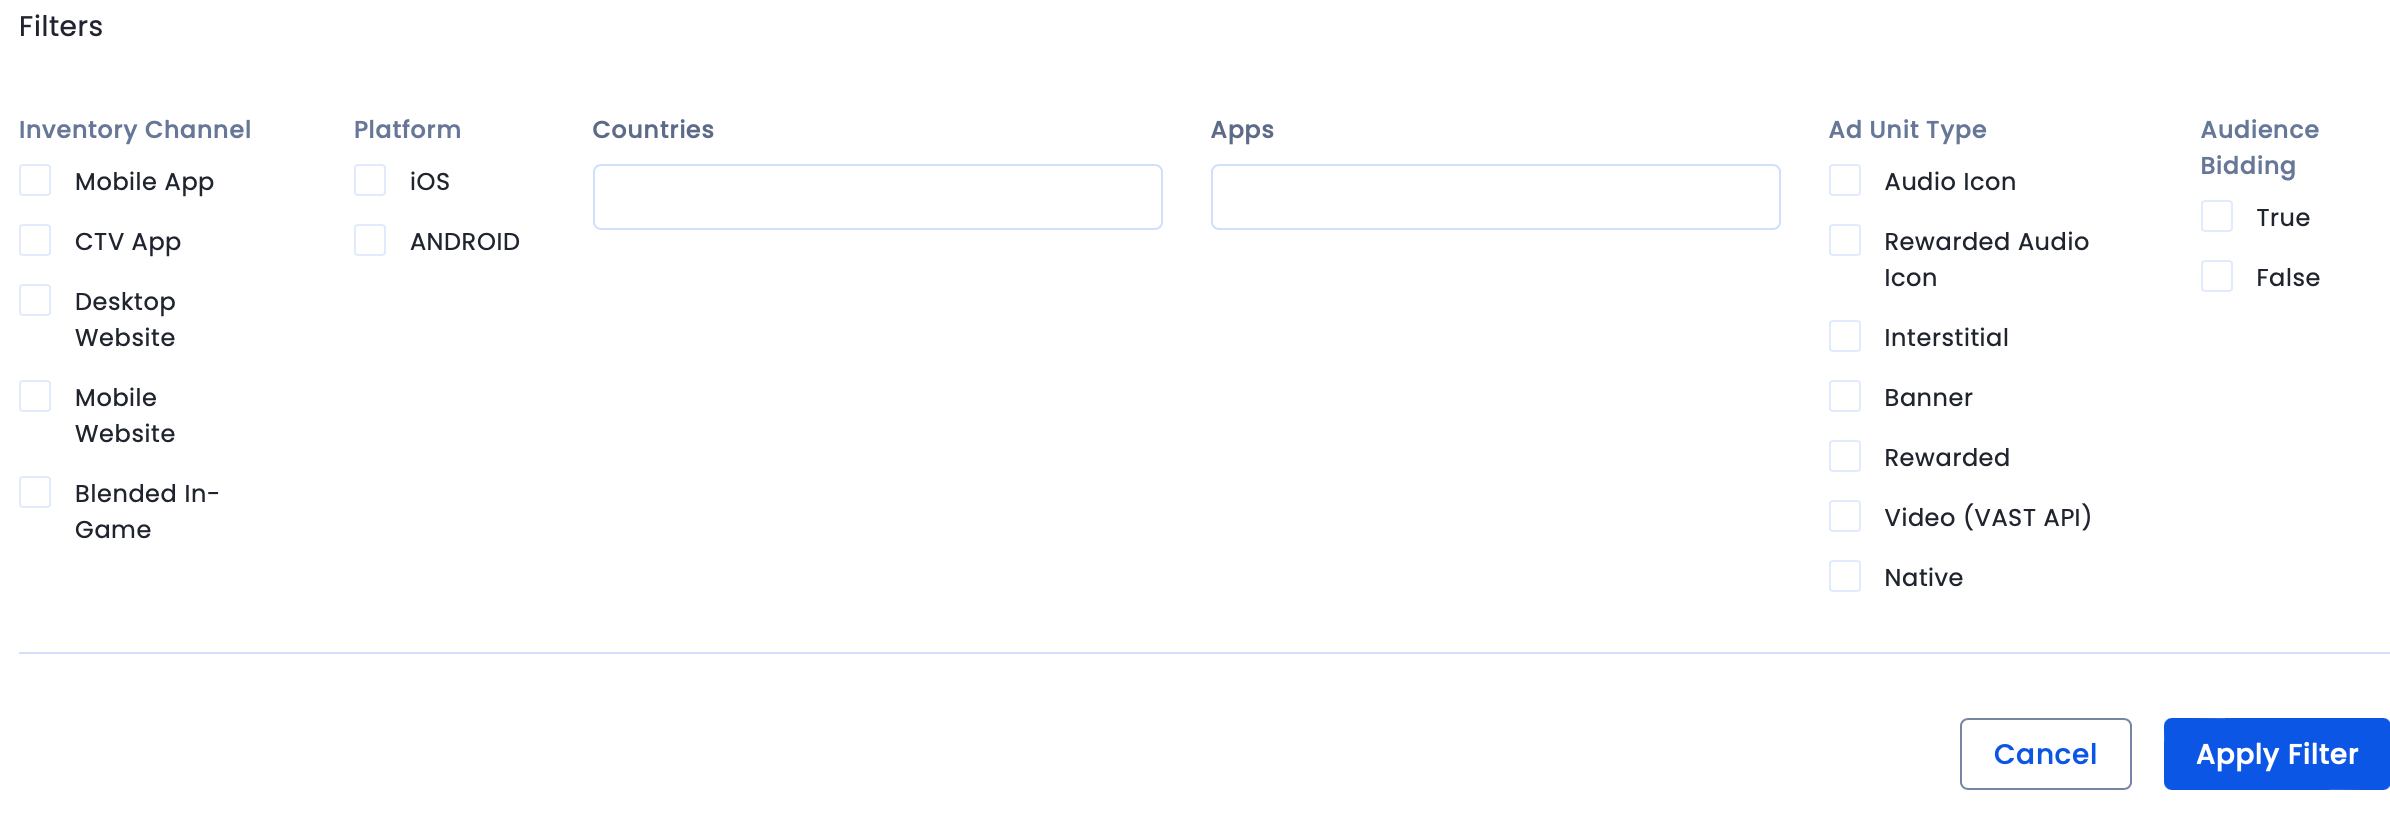
  3. Select the dimensions, measures, and filters relevant to your report.
  4. Add a date range for the report. You can select a custom date range or relative range like last 7 days, last 30 days, etc. All reports and dates follow the UTC time zone.
  5. Click Generate Report.

Managing Saved Reports

 Once you are done creating reports, check the Manage Reports sub-tab to clone or delete a report. Click the option icon for the report you want to manage.

Download Reports

In the Download Reports sub-tab, click the option icon for the report you want to download and select Download. In case an in-active report is created, click the option icon (ellipsis) for the report and select Re-run report.

Managing Your Dashboard

You can keep a track of your earnings and ad performance by going to Performance Dashboard. The dashboard overview consists of charts that provide a visualization of the following revenue and performance metrics: Revenue, eCPM, Ad Opportunities, and Impressions.

On This Page

Last Updated on: 29 May, 2023