The Performance Dashboard gives you a consolidated view of your revenue drivers, risks, and opportunities in one place. Use it to track earnings and ad performance at a glance, drill into your top-performing apps, ad units, and partners, and monitor anonymization and signal health across your inventory. This page walks you through each section of the dashboard and how to use it.
The page is divided into the following sections:
Managing Your Dashboard
- Navigate to Performance >> Dashboard to track your earnings and ad performance. Click Back to Old Dashboard at any time to switch to the previous view.
- Select a date range from the Date drop-down menu (Last 7 Days, Last 14 Days, Last 30 Days, or Custom Date Range), and a country from the Country drop-down to filter your report.
- Click Add Filter to apply additional filters. Choose one or more categories:
- Ad Unit
- Platform
- Inventory Channel
- Applications
- Mediation Partners
- Placement
Your Performance at a Glance
Review Your Performance at a Glance for your key metrics. Each card shows the current value, percentage change over the previous period, and a daily trend chart.
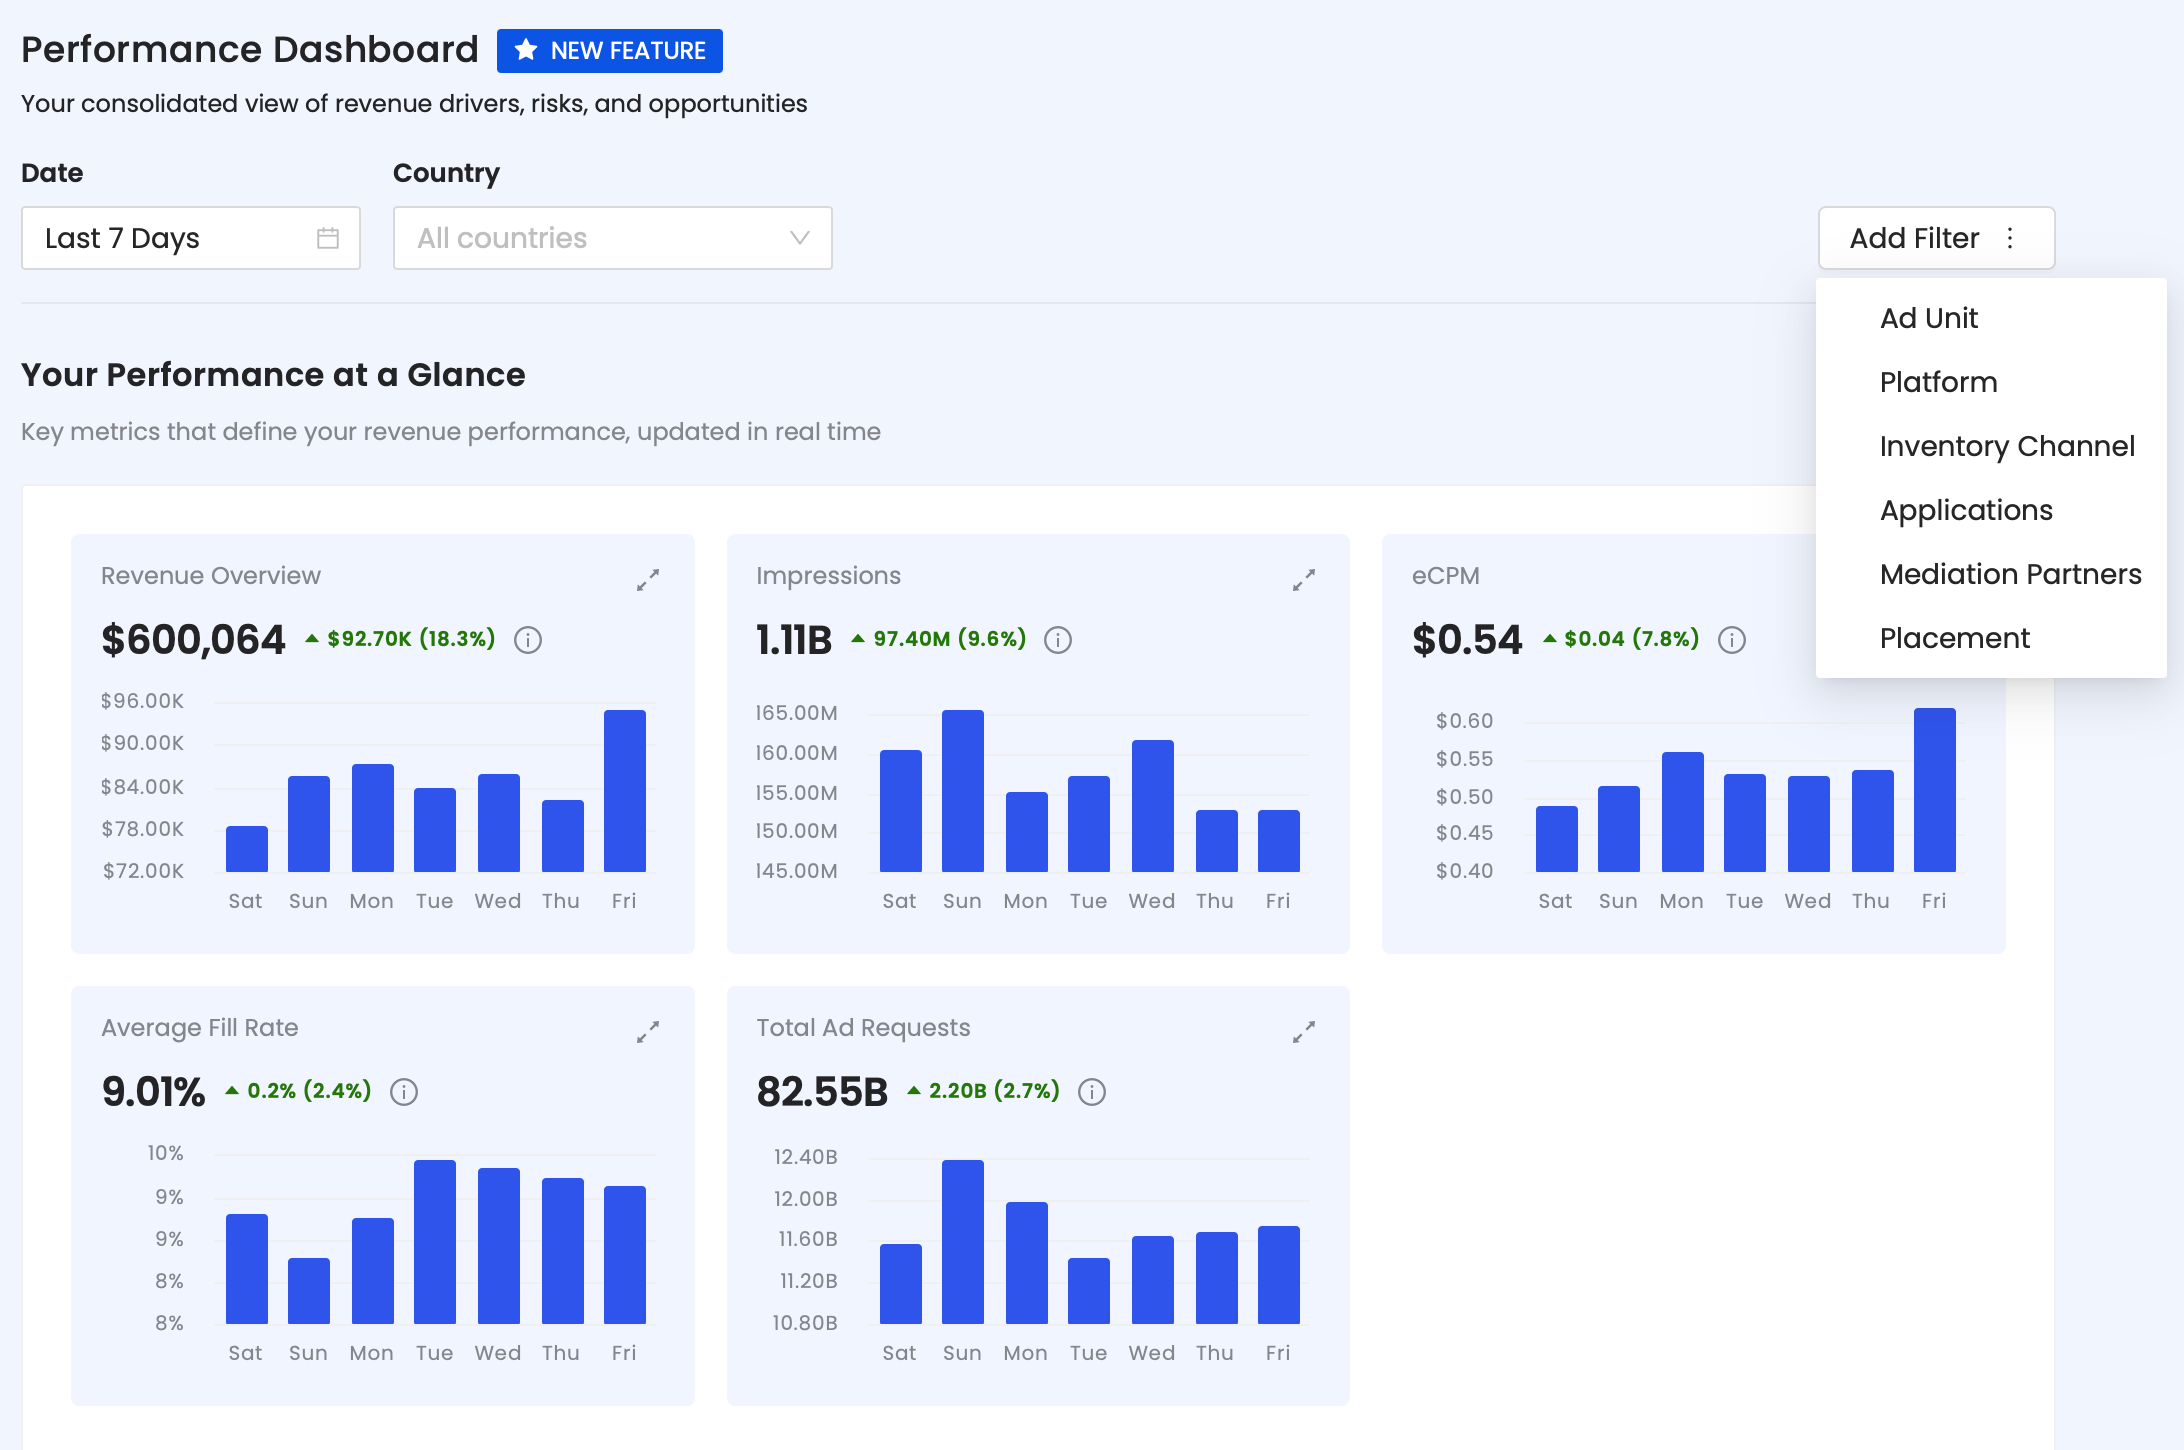
View performance over time for the following metrics:
- Revenue Overview
- Impressions
- eCPM
- Average Fill Rate
- Total Ad Requests
Viewing Top Performers
- Go to Top Performers Overview to see your top-performing apps, ad units, and placements.
- Use the Select a Specific Metric drop-down to choose the metric from Revenue, Impressions, Total Ad Requests, Average Fill Rate, or eCPM.
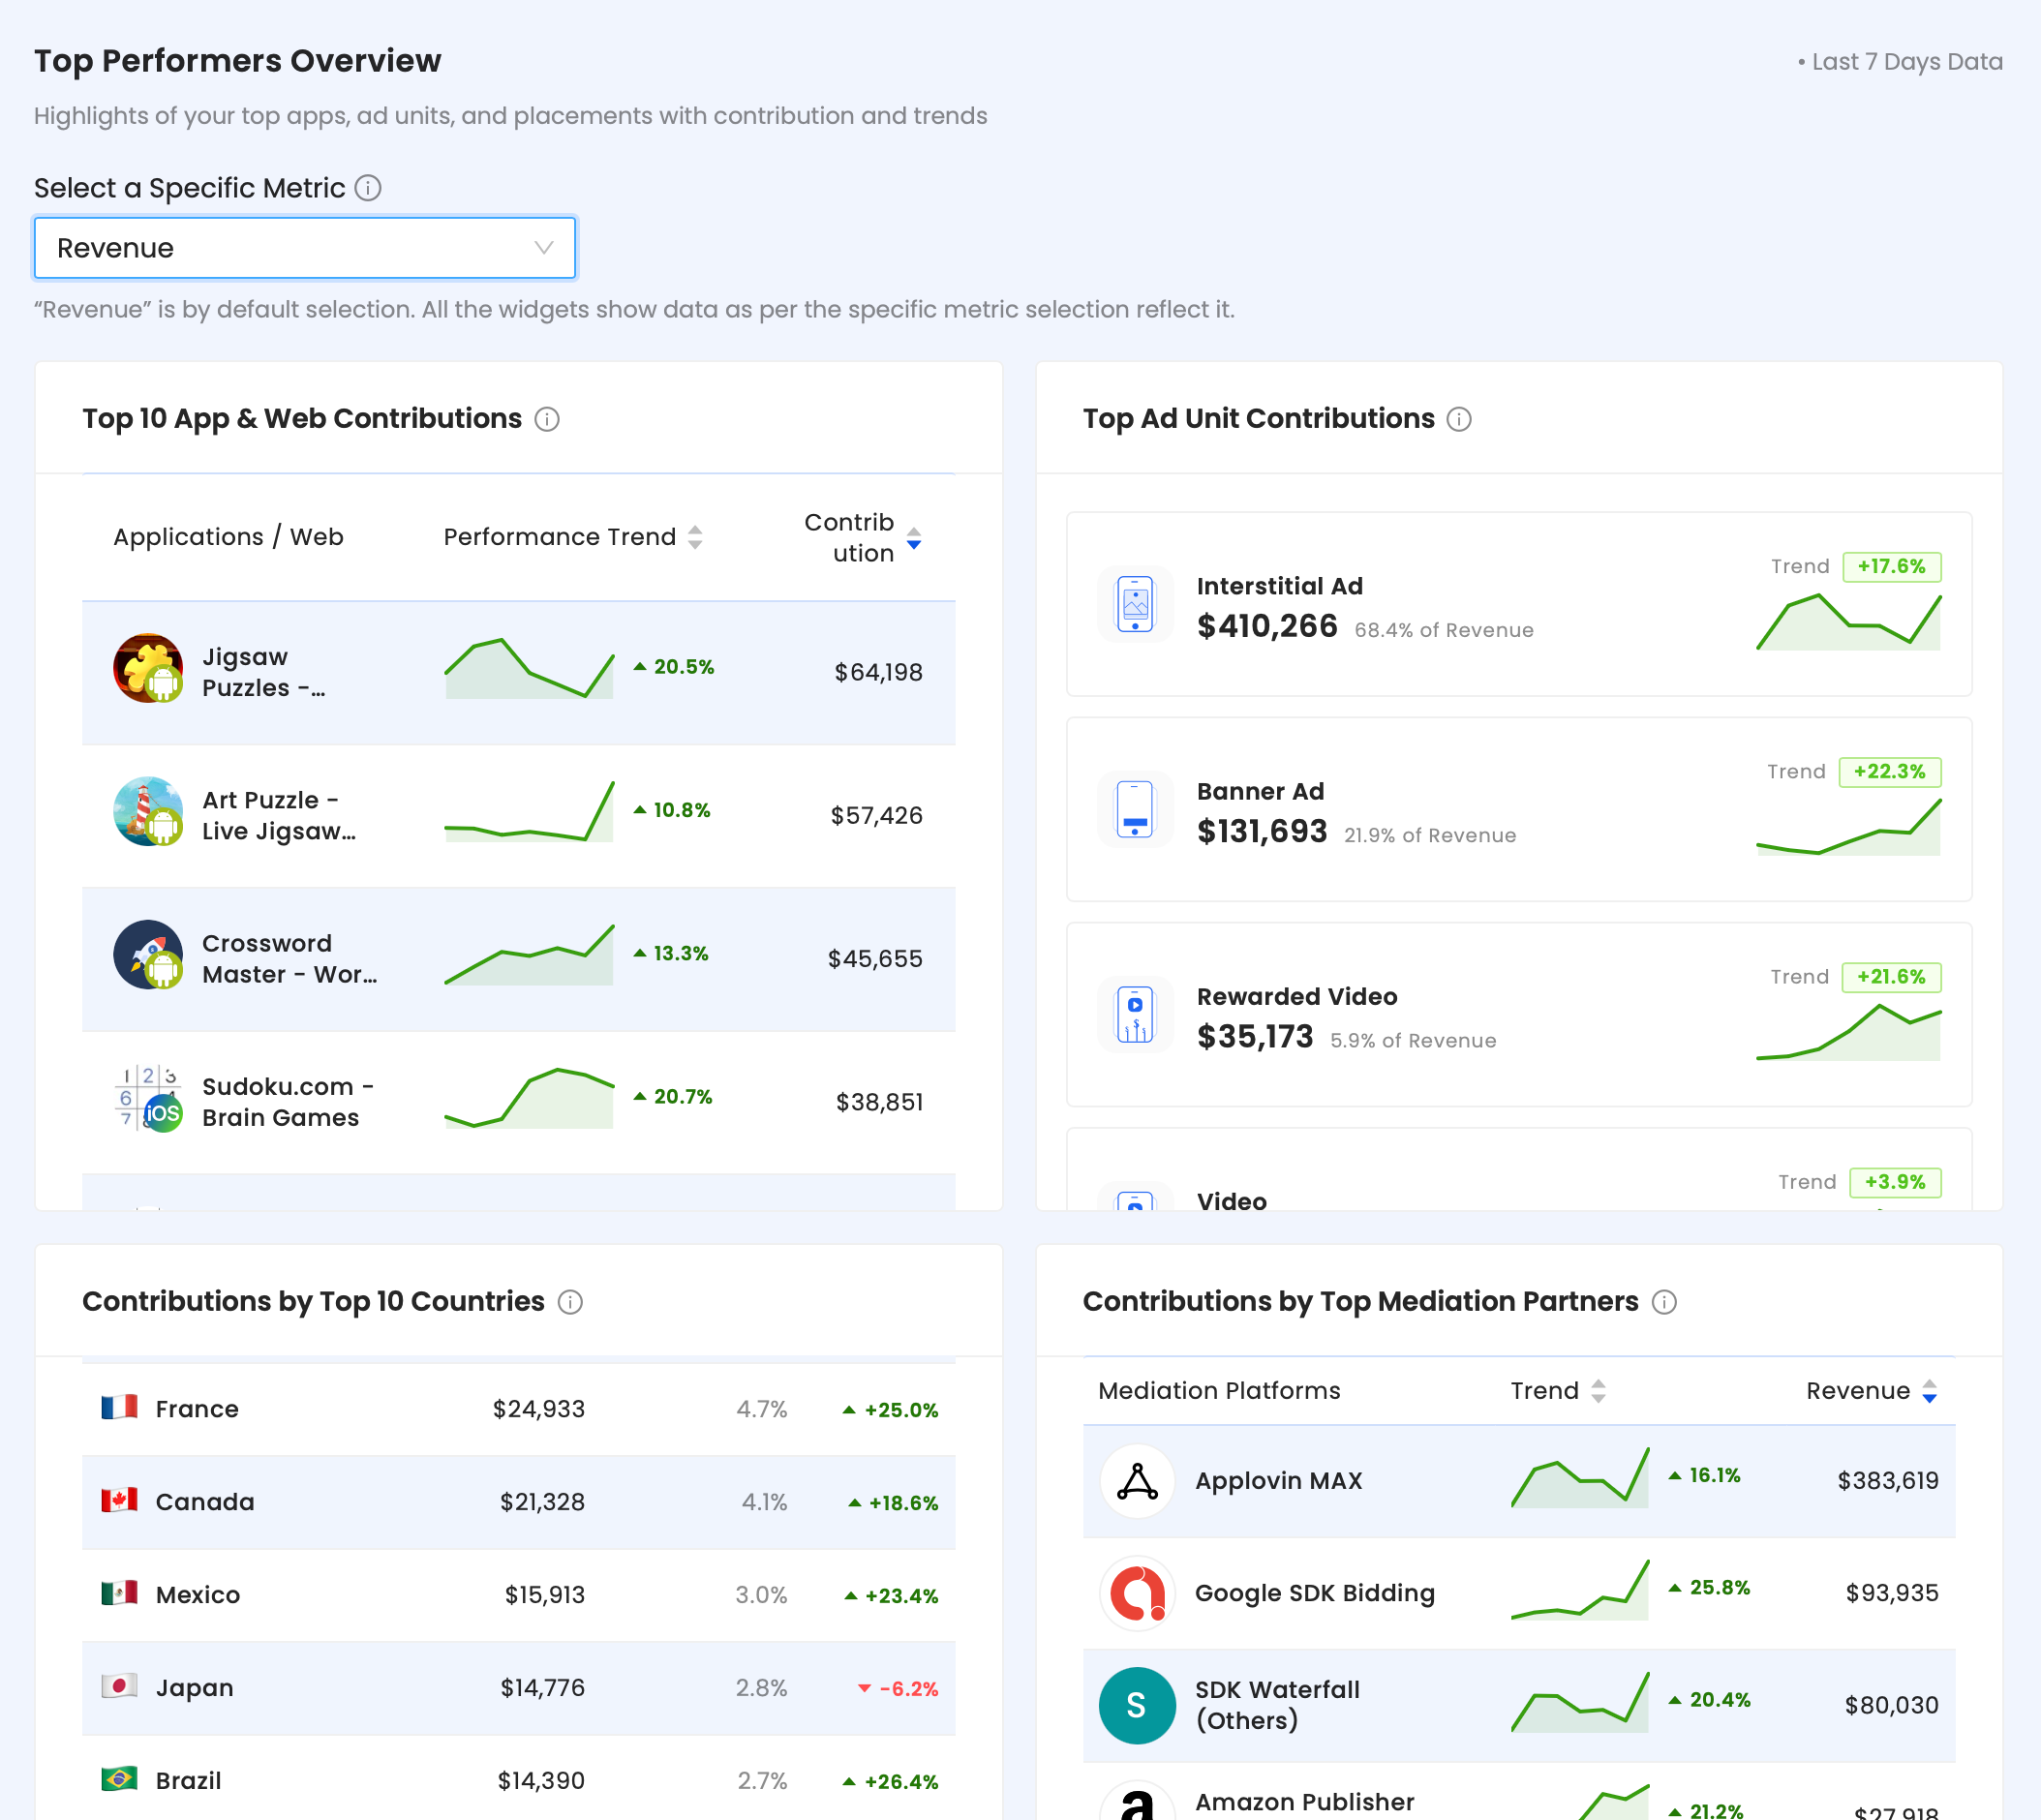
- Review the following widgets:
- Top Apps: lists apps with a trend line and total value for the selected metric.
- Top Ad Unit Contributions: shows each ad unit's contribution, % of revenue, and trend.
- Contributions by Top 10 Countries: a sortable table of revenue, % of total, and trend by country.
- Contributions by Top Mediation Partners: a sortable table of trends and revenue by mediation platform.
Tracking Anonymization & Signal Health
- Go to Anonymization & Signal Health to track anonymized request volume, signal coverage, and eCPM impact.
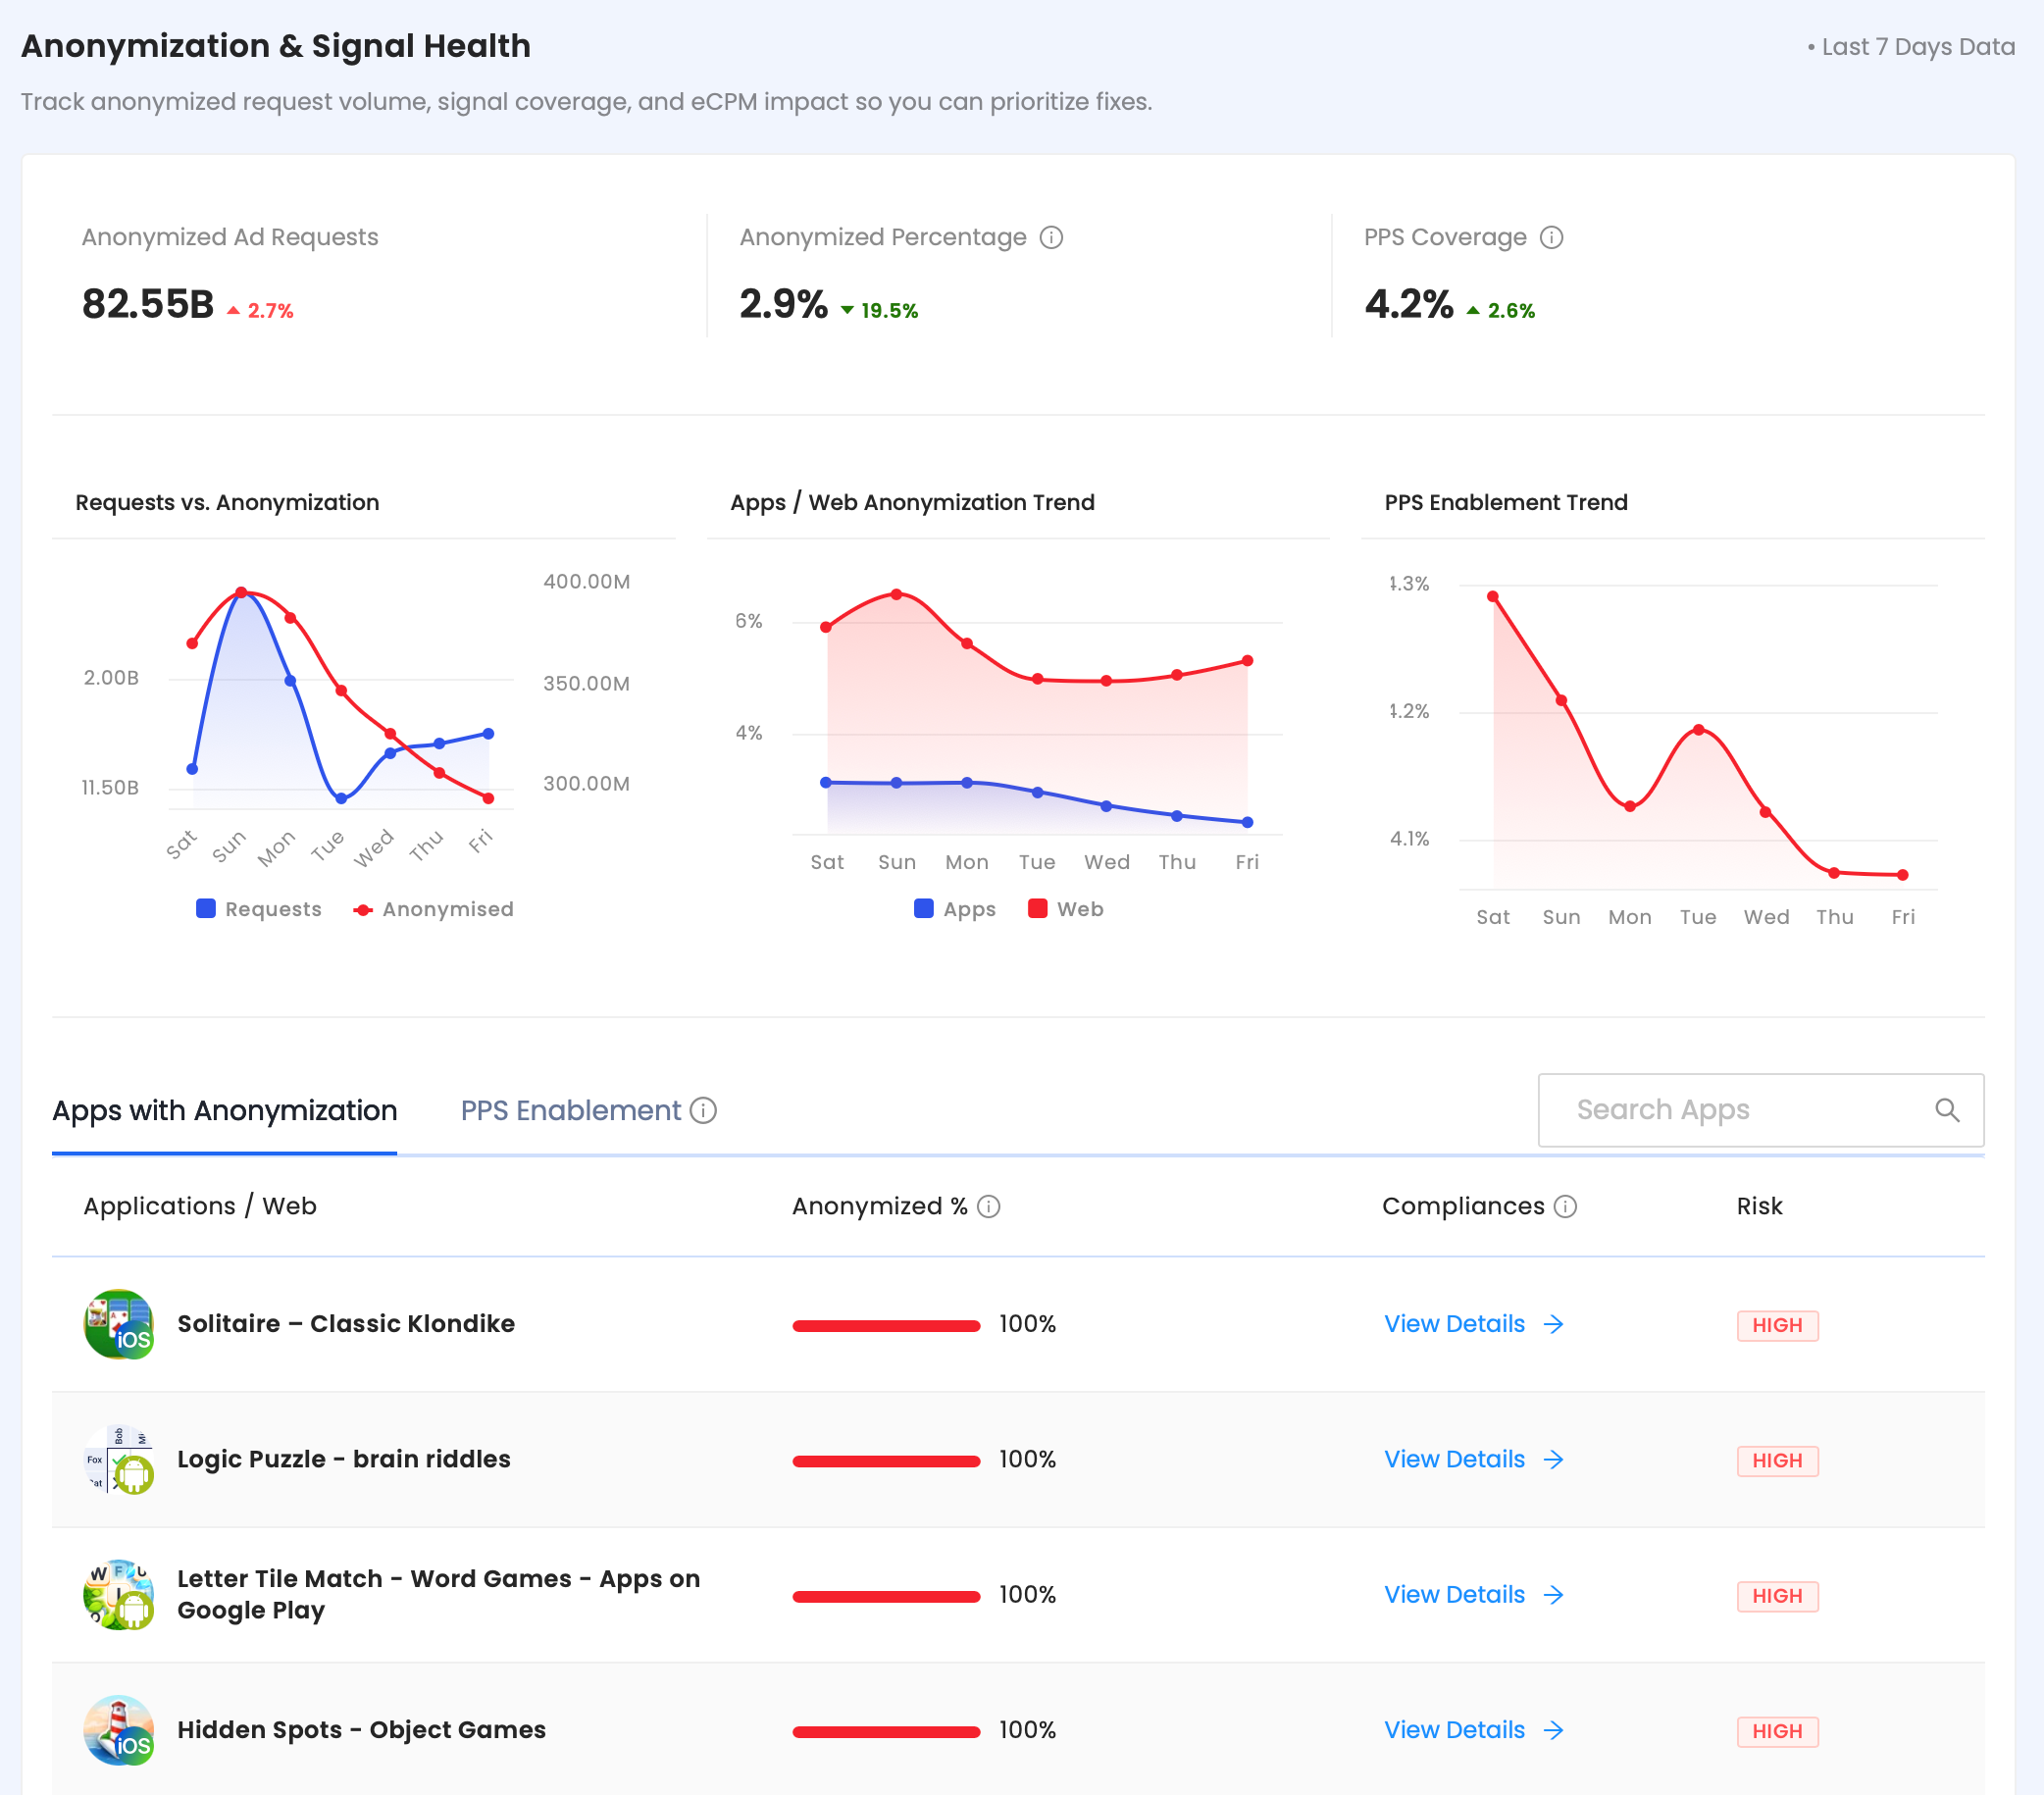
- Review the summary metrics:
- Anonymized Ad Requests
- Anonymized Percentage
- PPS Coverage
- Use the trend charts to spot patterns over the selected date range:
- Requests vs. Anonymization
- Apps / Web Anonymization Trend
- PPS Enablement Trend
- Switch between the Apps with Anonymization and PPS Enablement tabs to view each app's anonymized percentage, compliance status, and risk level. Use Search Apps to find a specific app, and click View Details to review compliance insights.
 Support Center


