InMobi CMP offers granular analytics to help you optimize and maximize your consent rate. You can view consent data for different regulations such as GDPR, CCPA and MSPA, and their opt-in rates according to countries for your apps and websites.
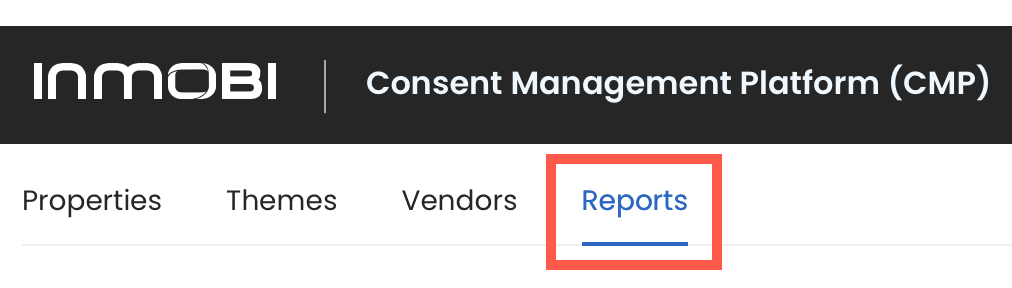
The Reports tab has two sections: Dashboard and Analytics.
The dashboard offers a pre-built set of comprehensive trends and metrics. These are not customizable.
The Summary allows you to view and compare data between two time durations for the chosen property.

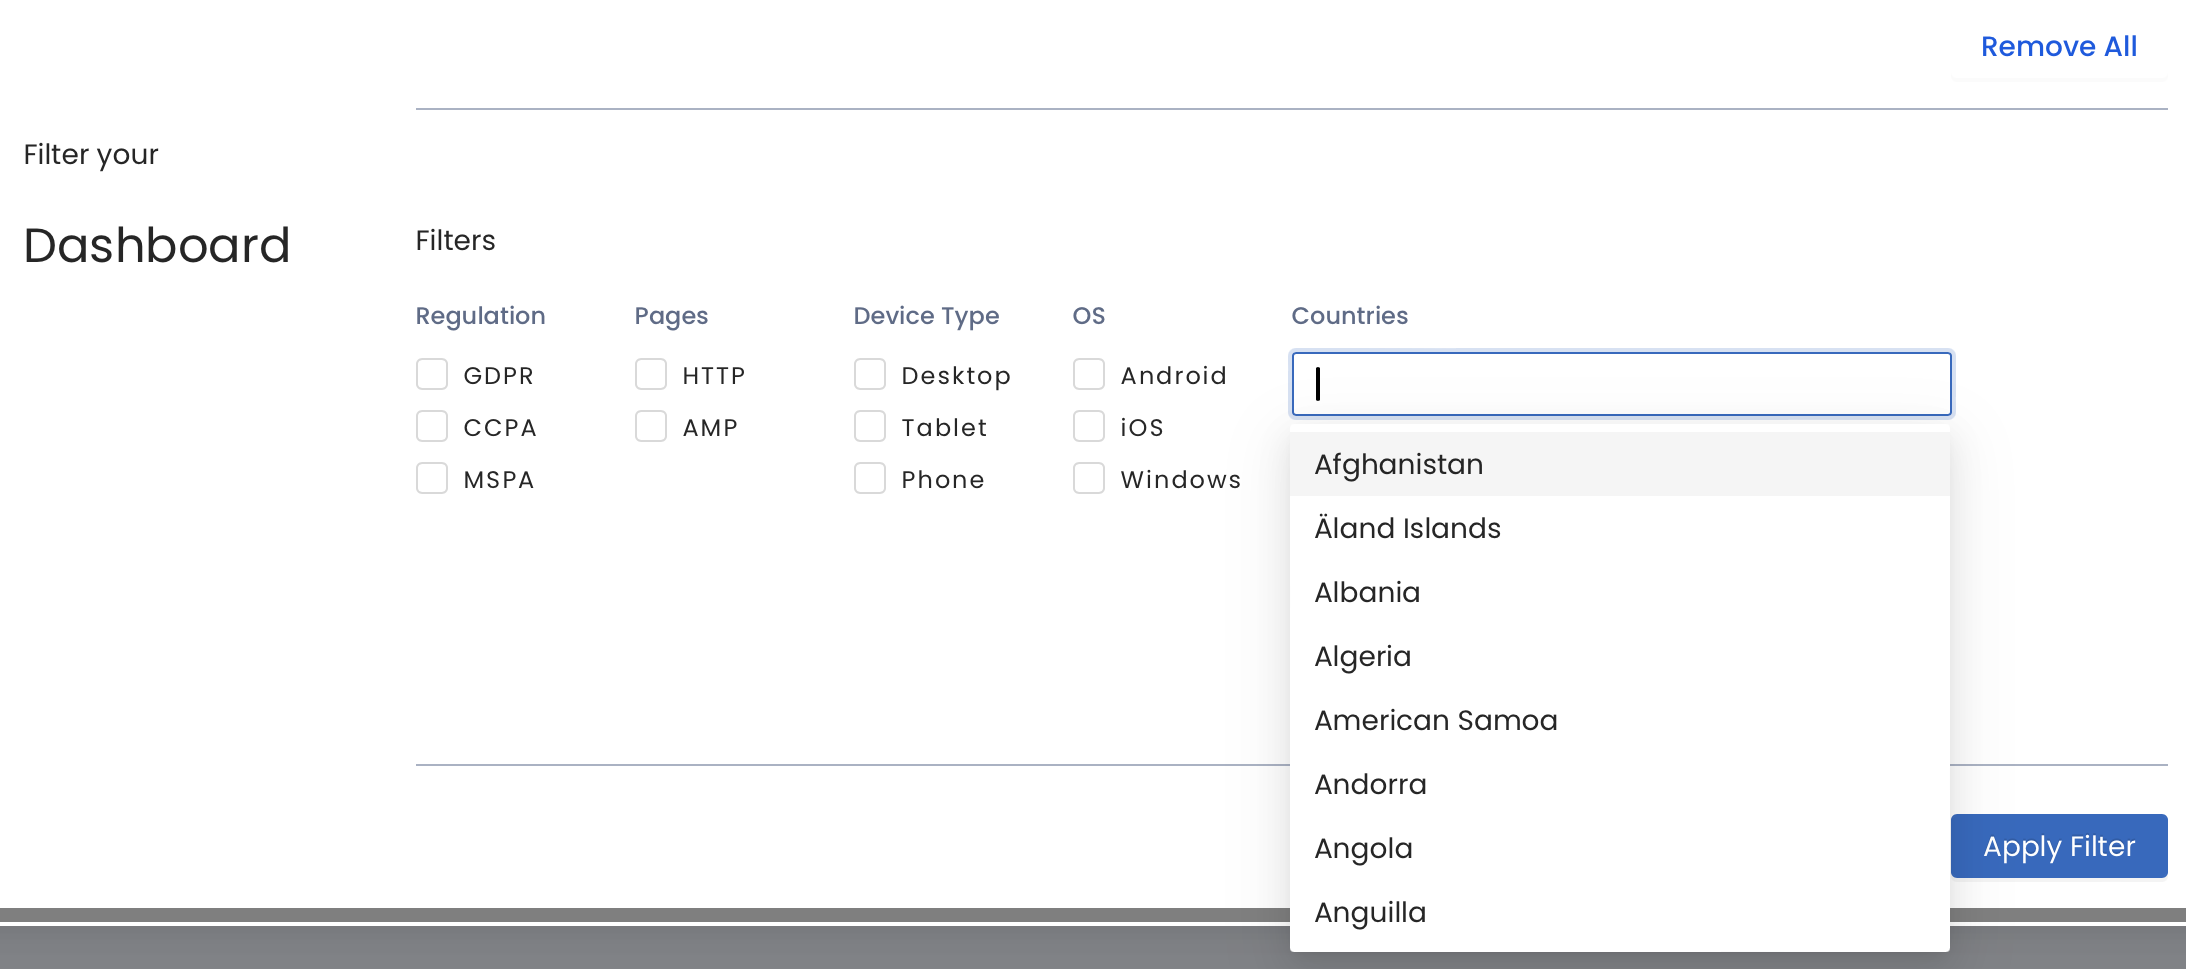
Under Detailed Insights, you can use Filters to view in-depth data for a specific Regulation, Pages, Device Type, OS, and Country during a particular time.
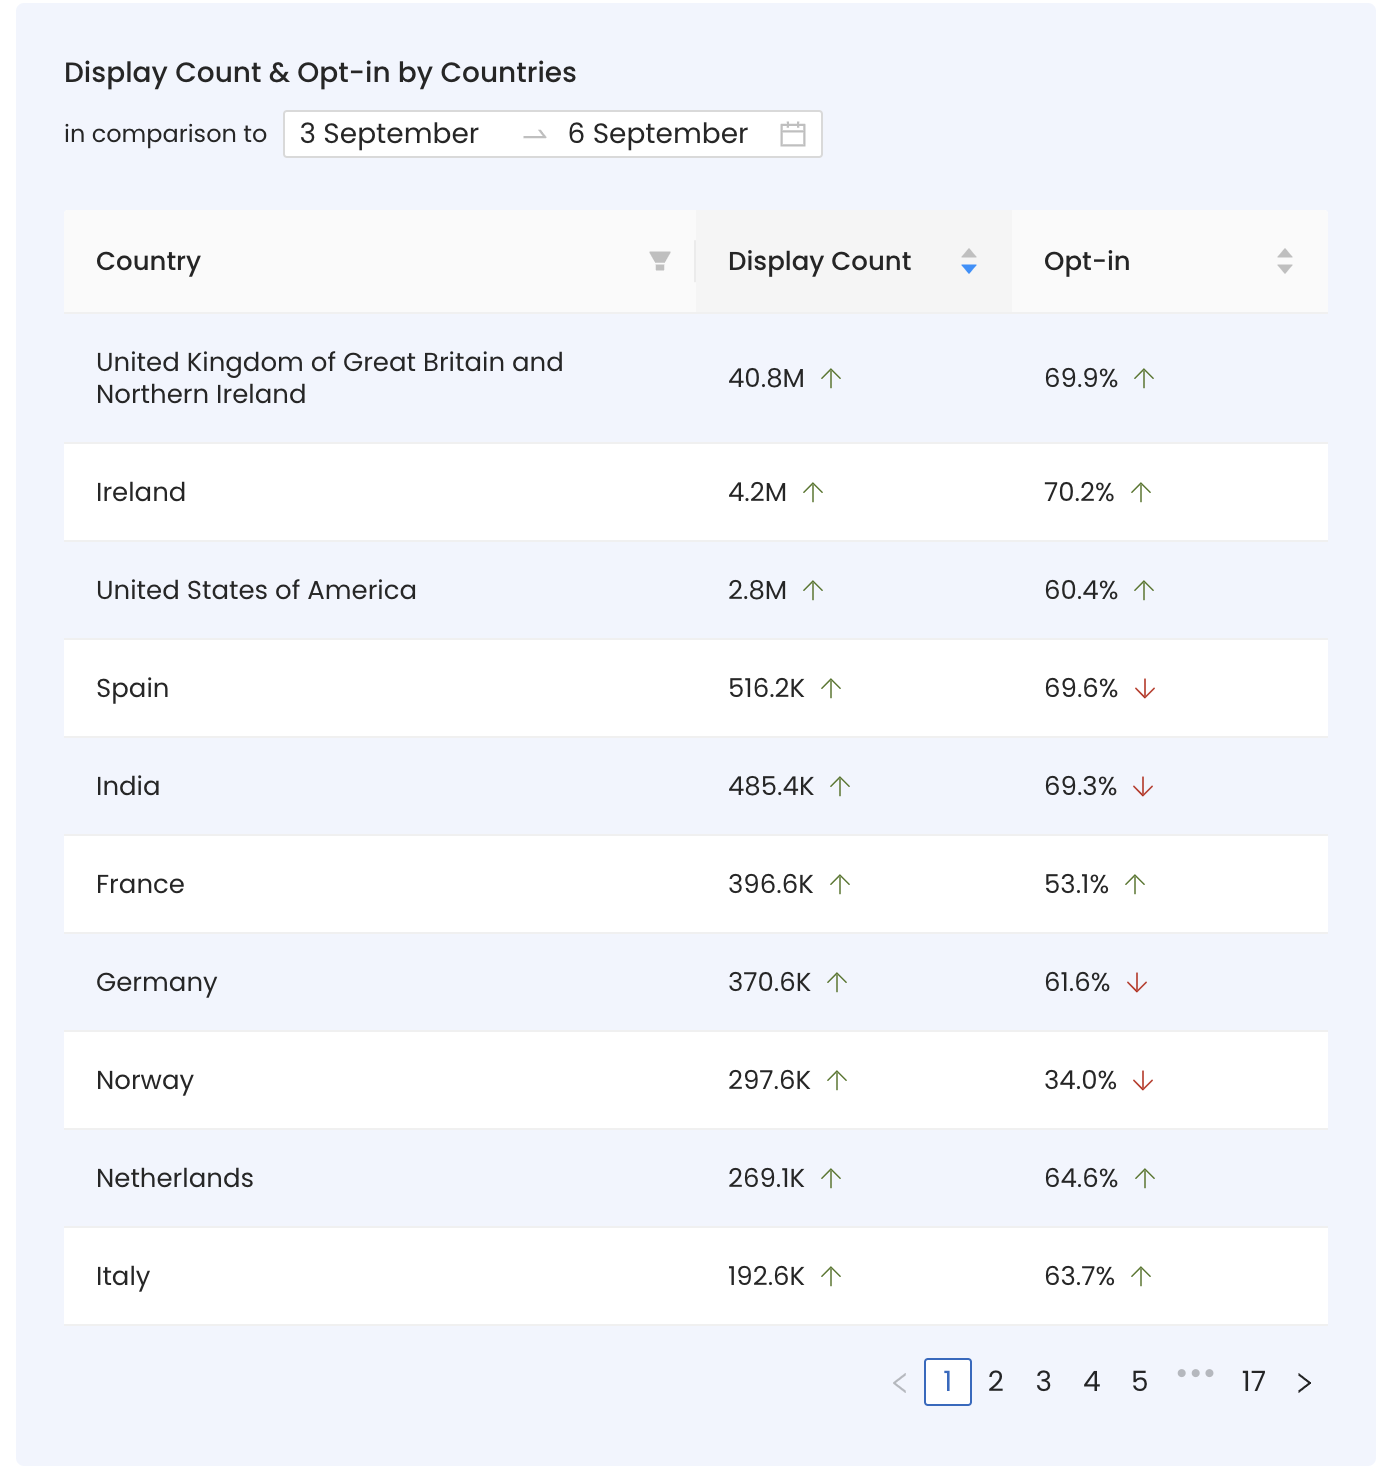
You can view country-wise traffic and consent rates during a specific time period to understand which countries generate the most traffic and opt-ins.
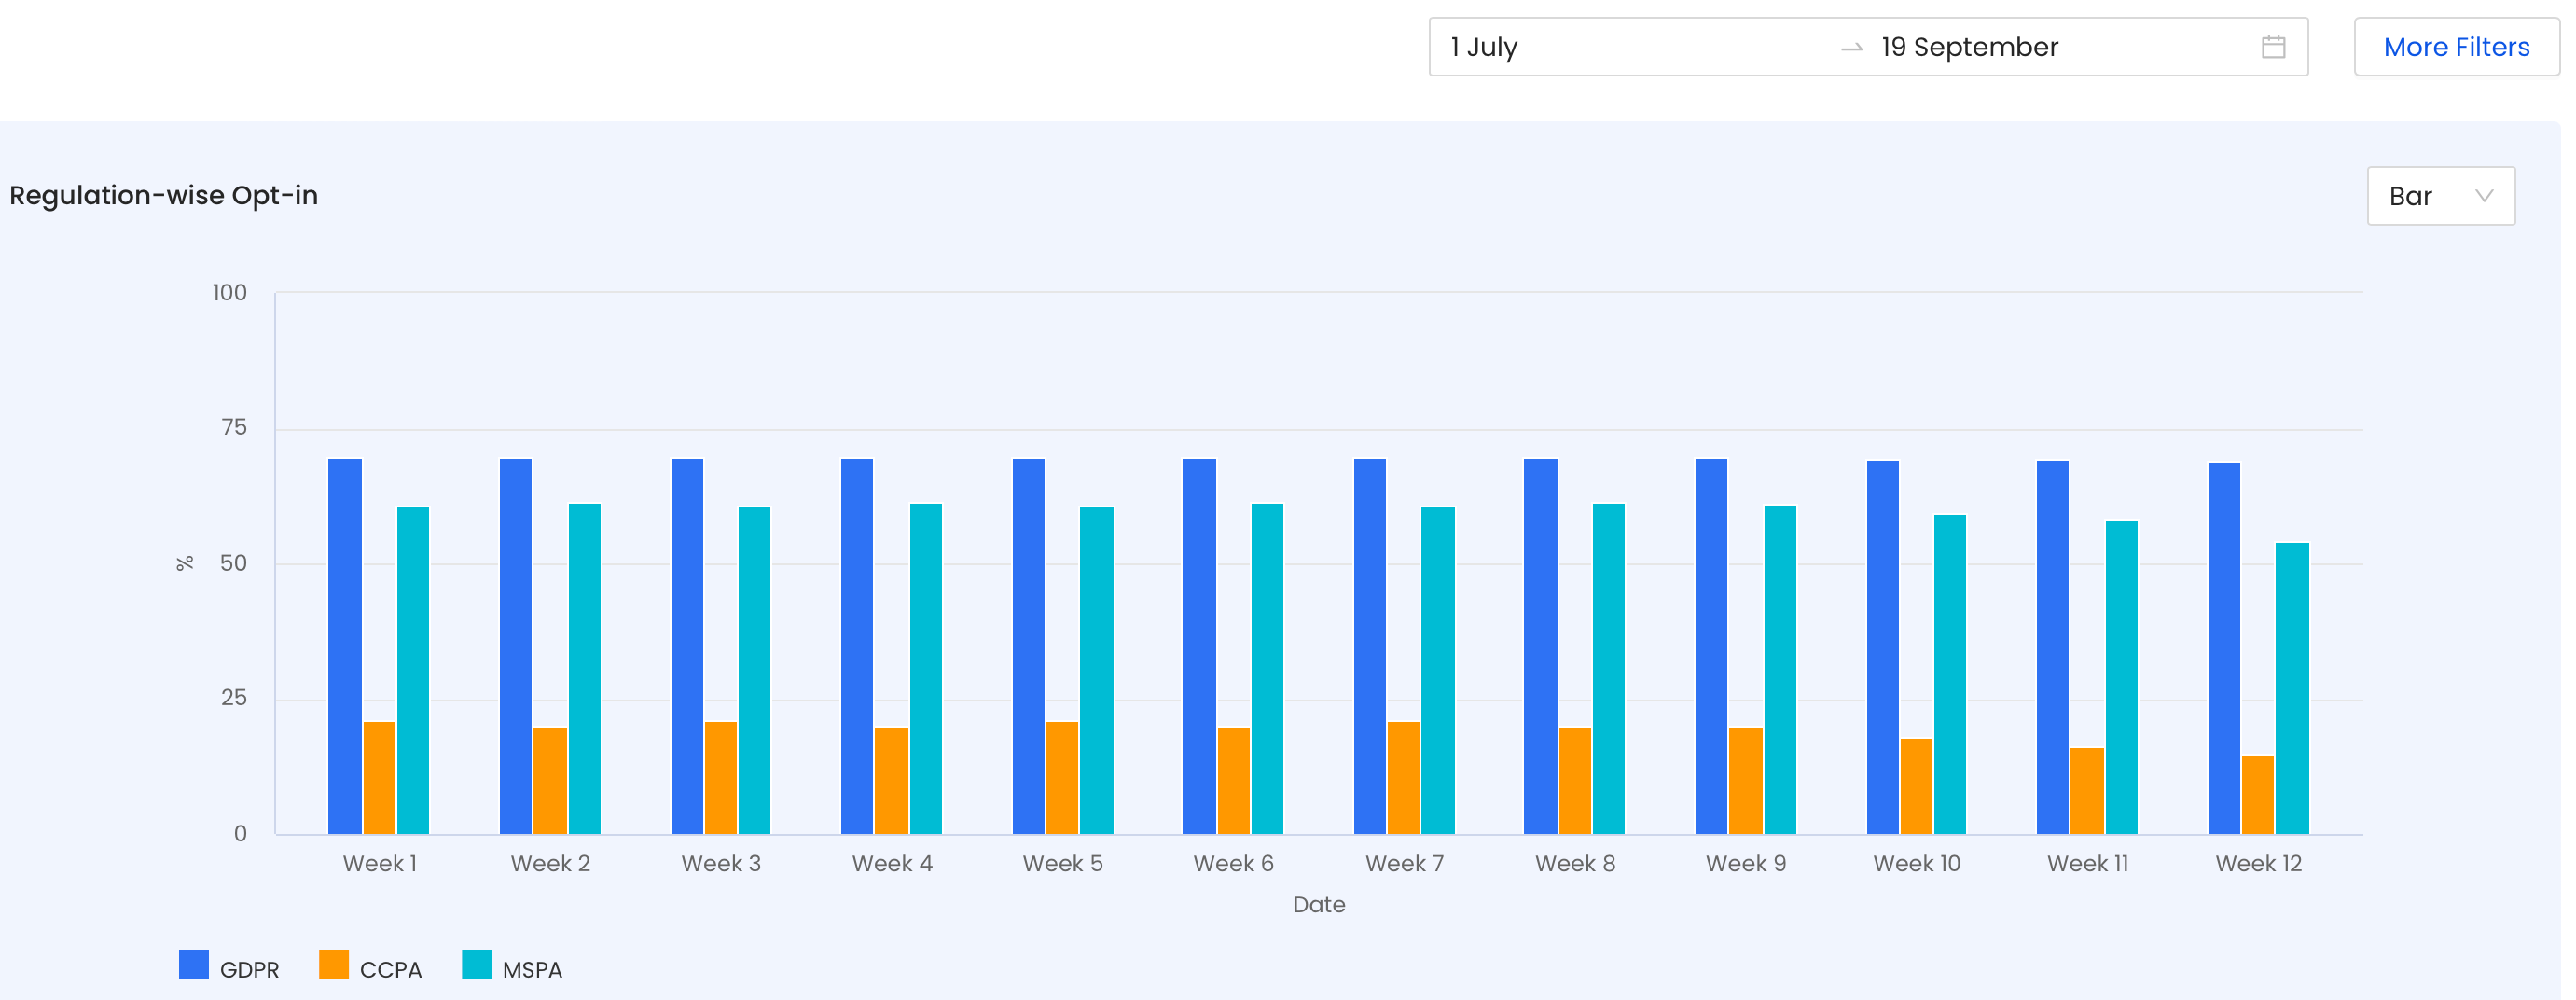
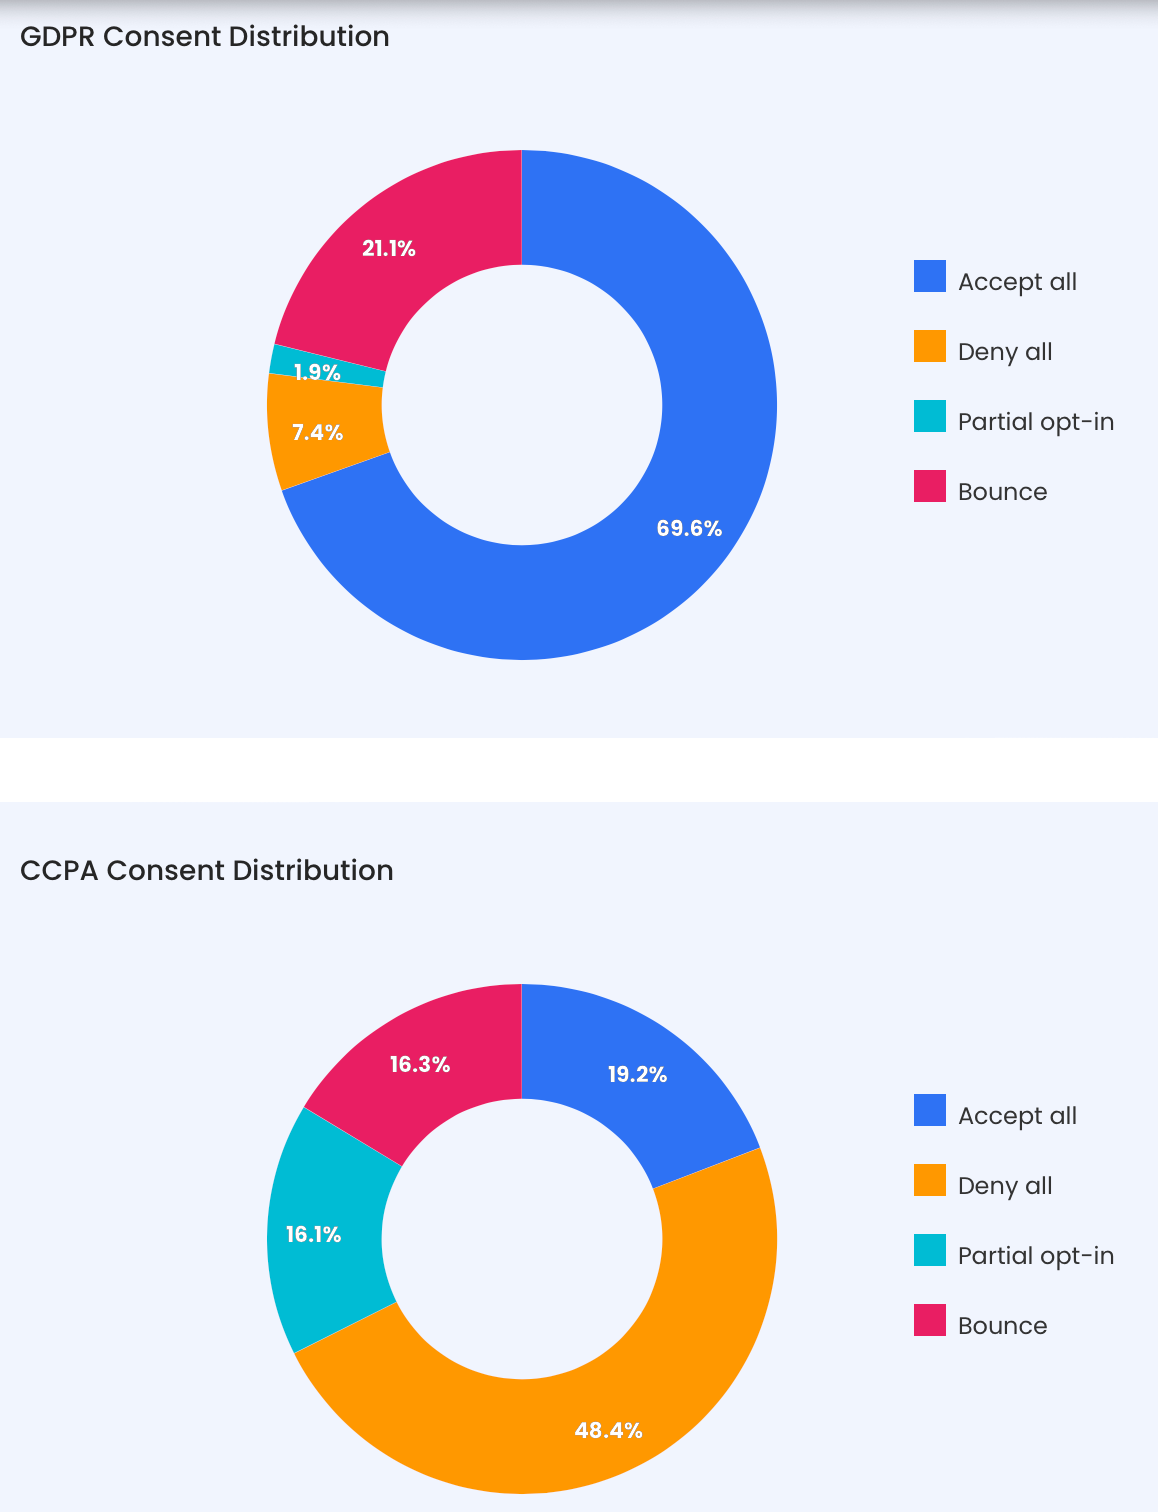
The two pie charts at the bottom of the dashboard reflect the regulation-wise consent distribution data between GDPR and CCPA.
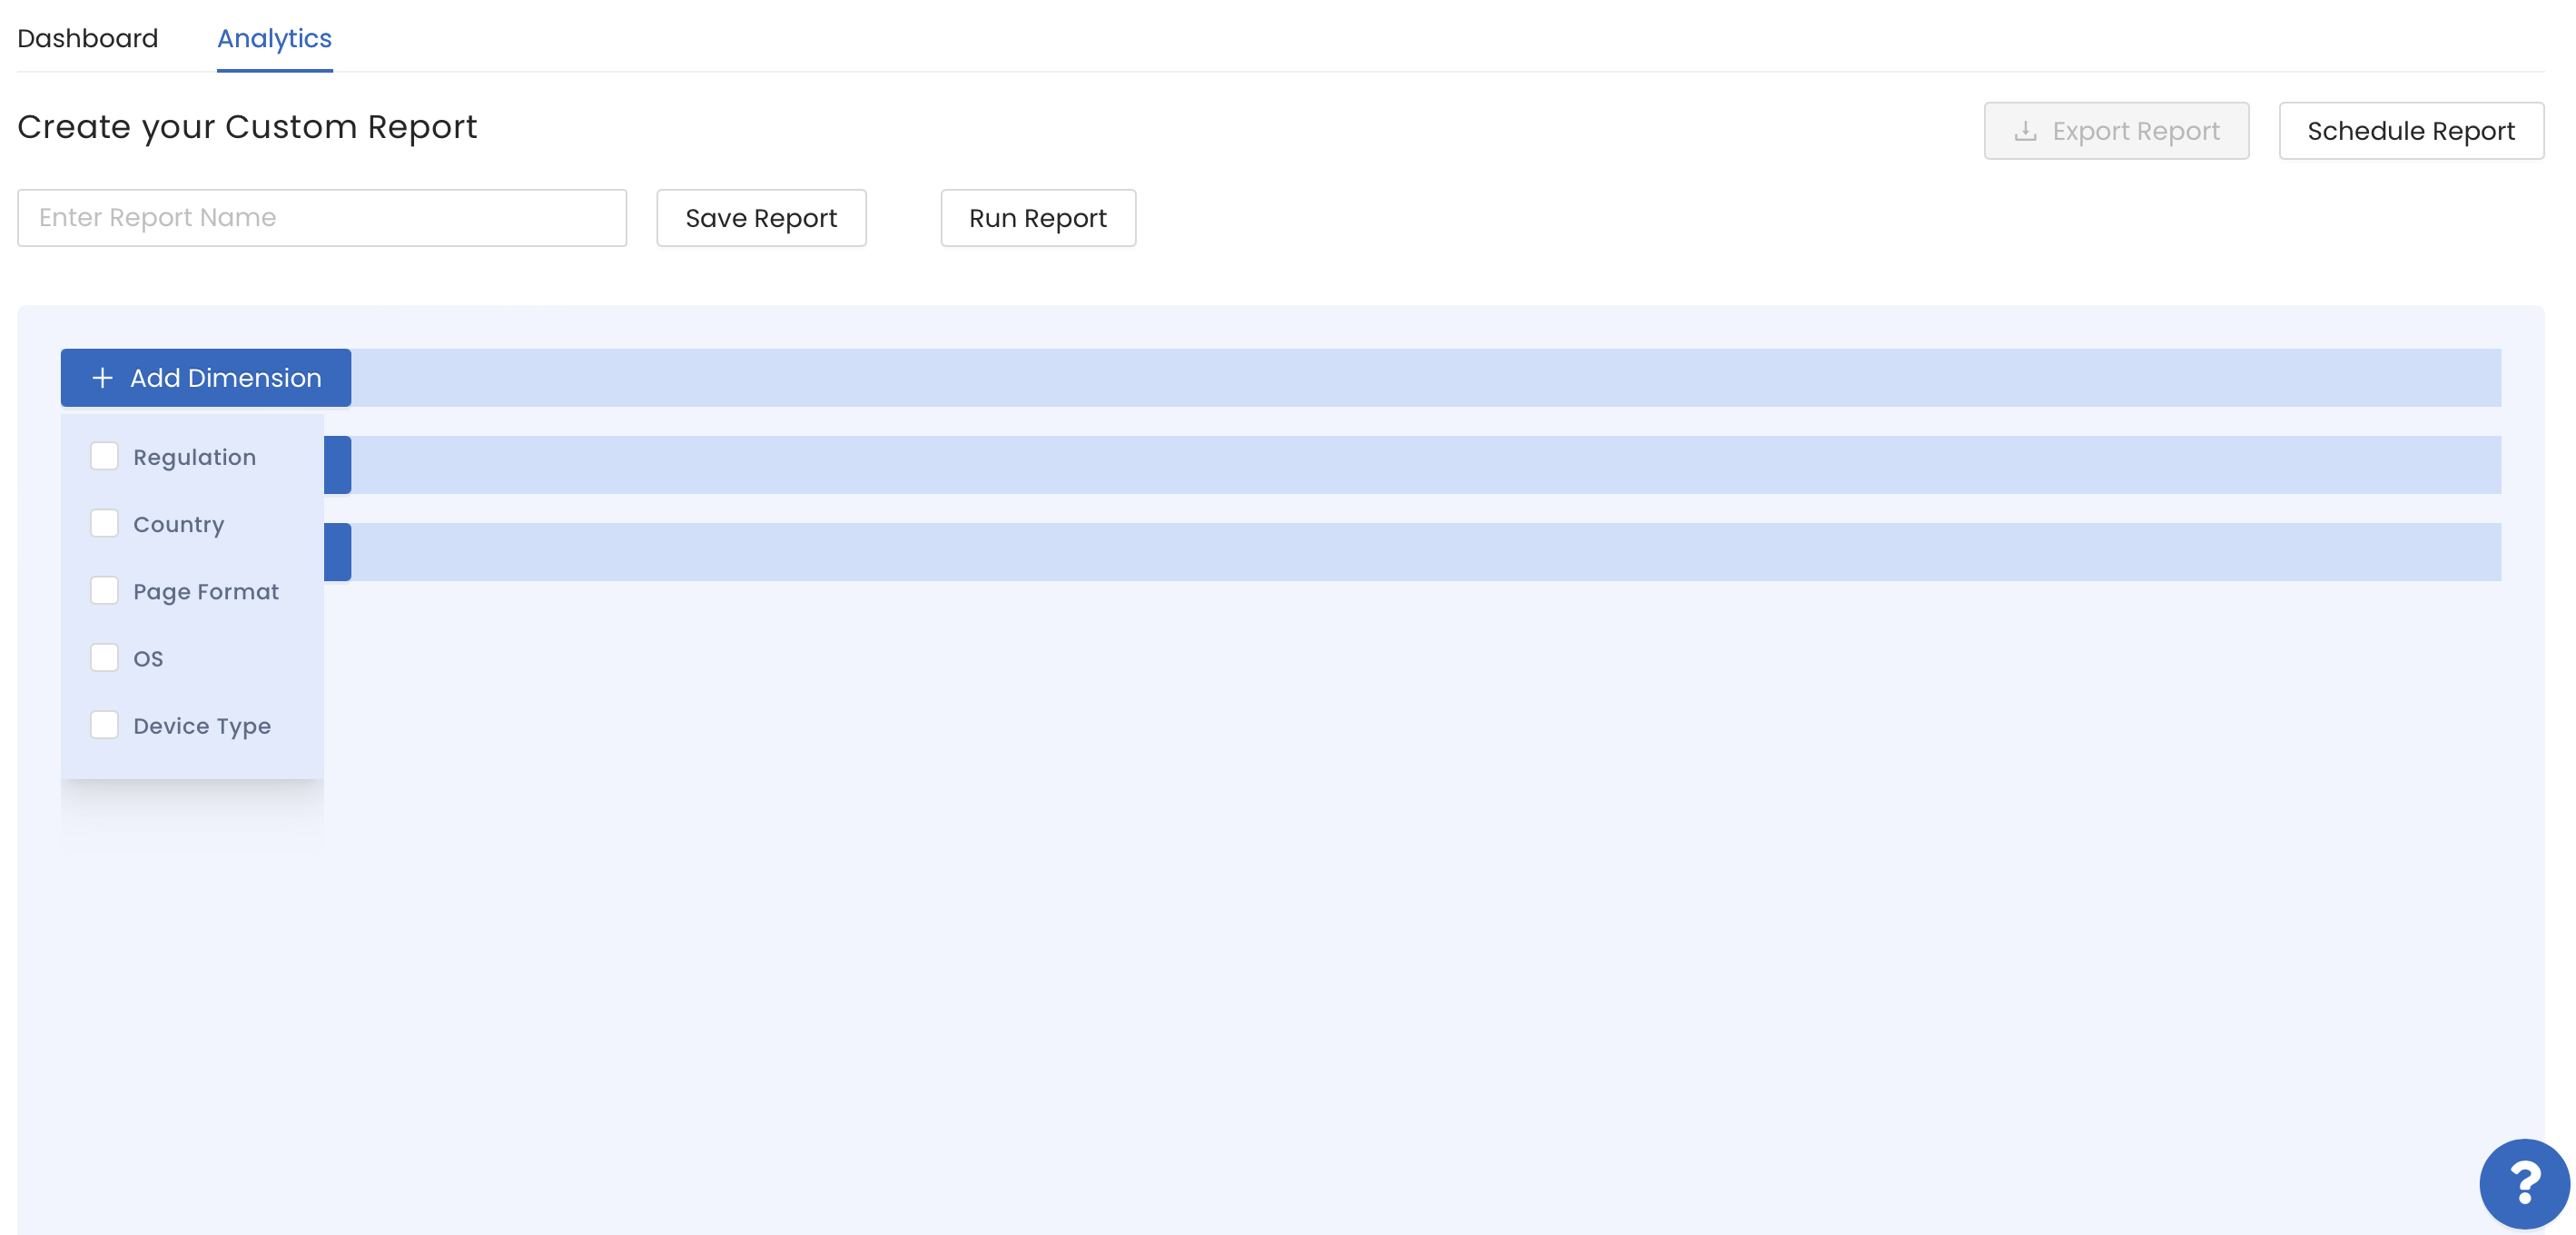
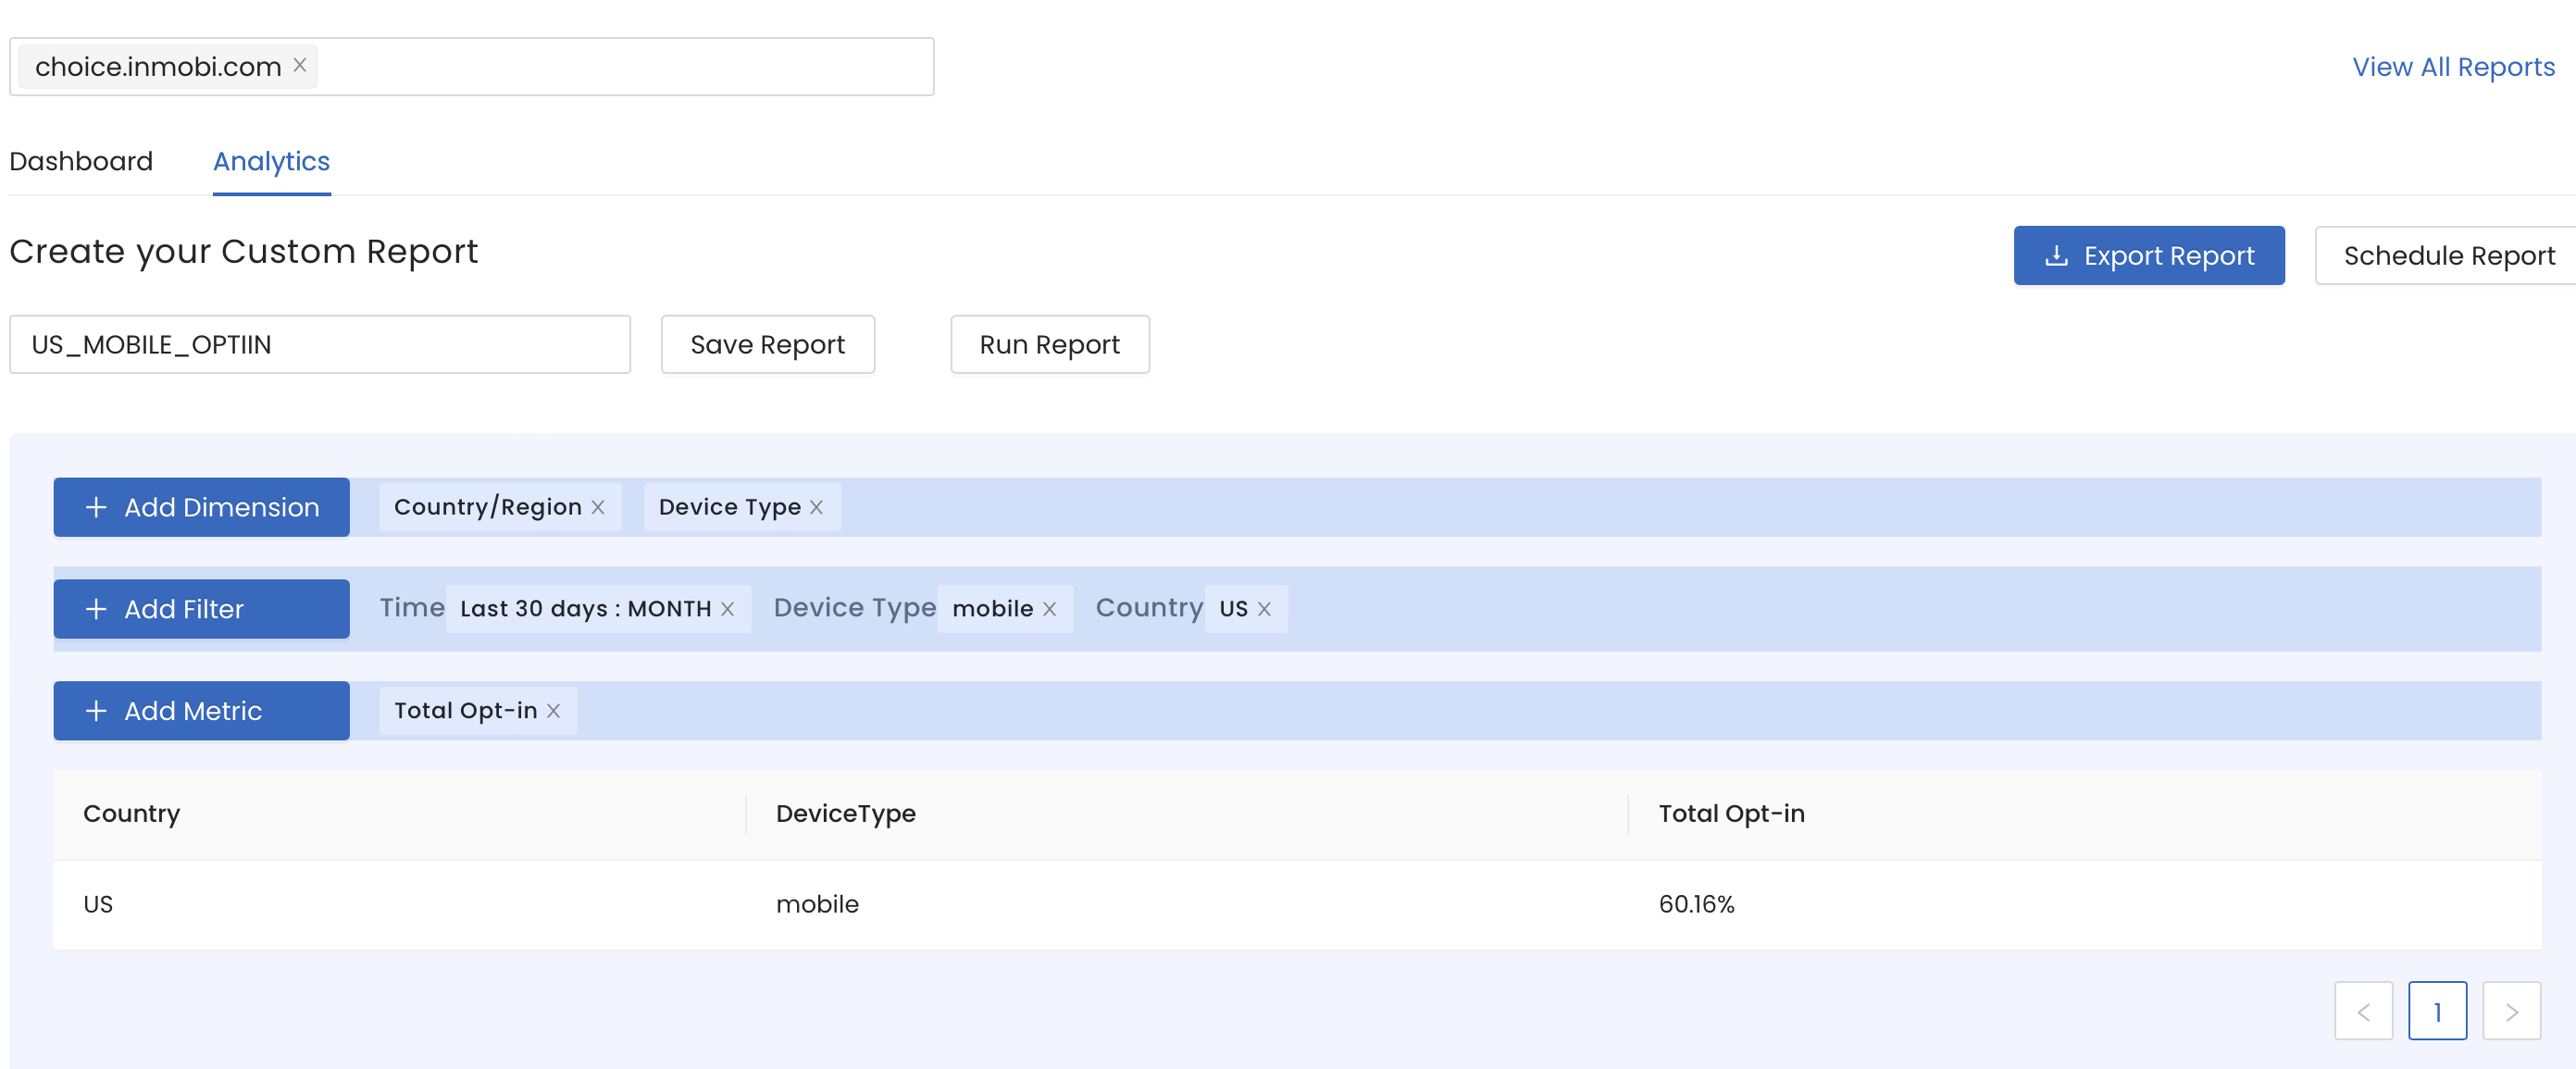
The Analytics offers a visualization of custom reports generated after selecting dimensions, filters, and metrics of your choice.
Dimensions are attributes by which you filter and group data.
InMobi CMP supports the following dimensions:
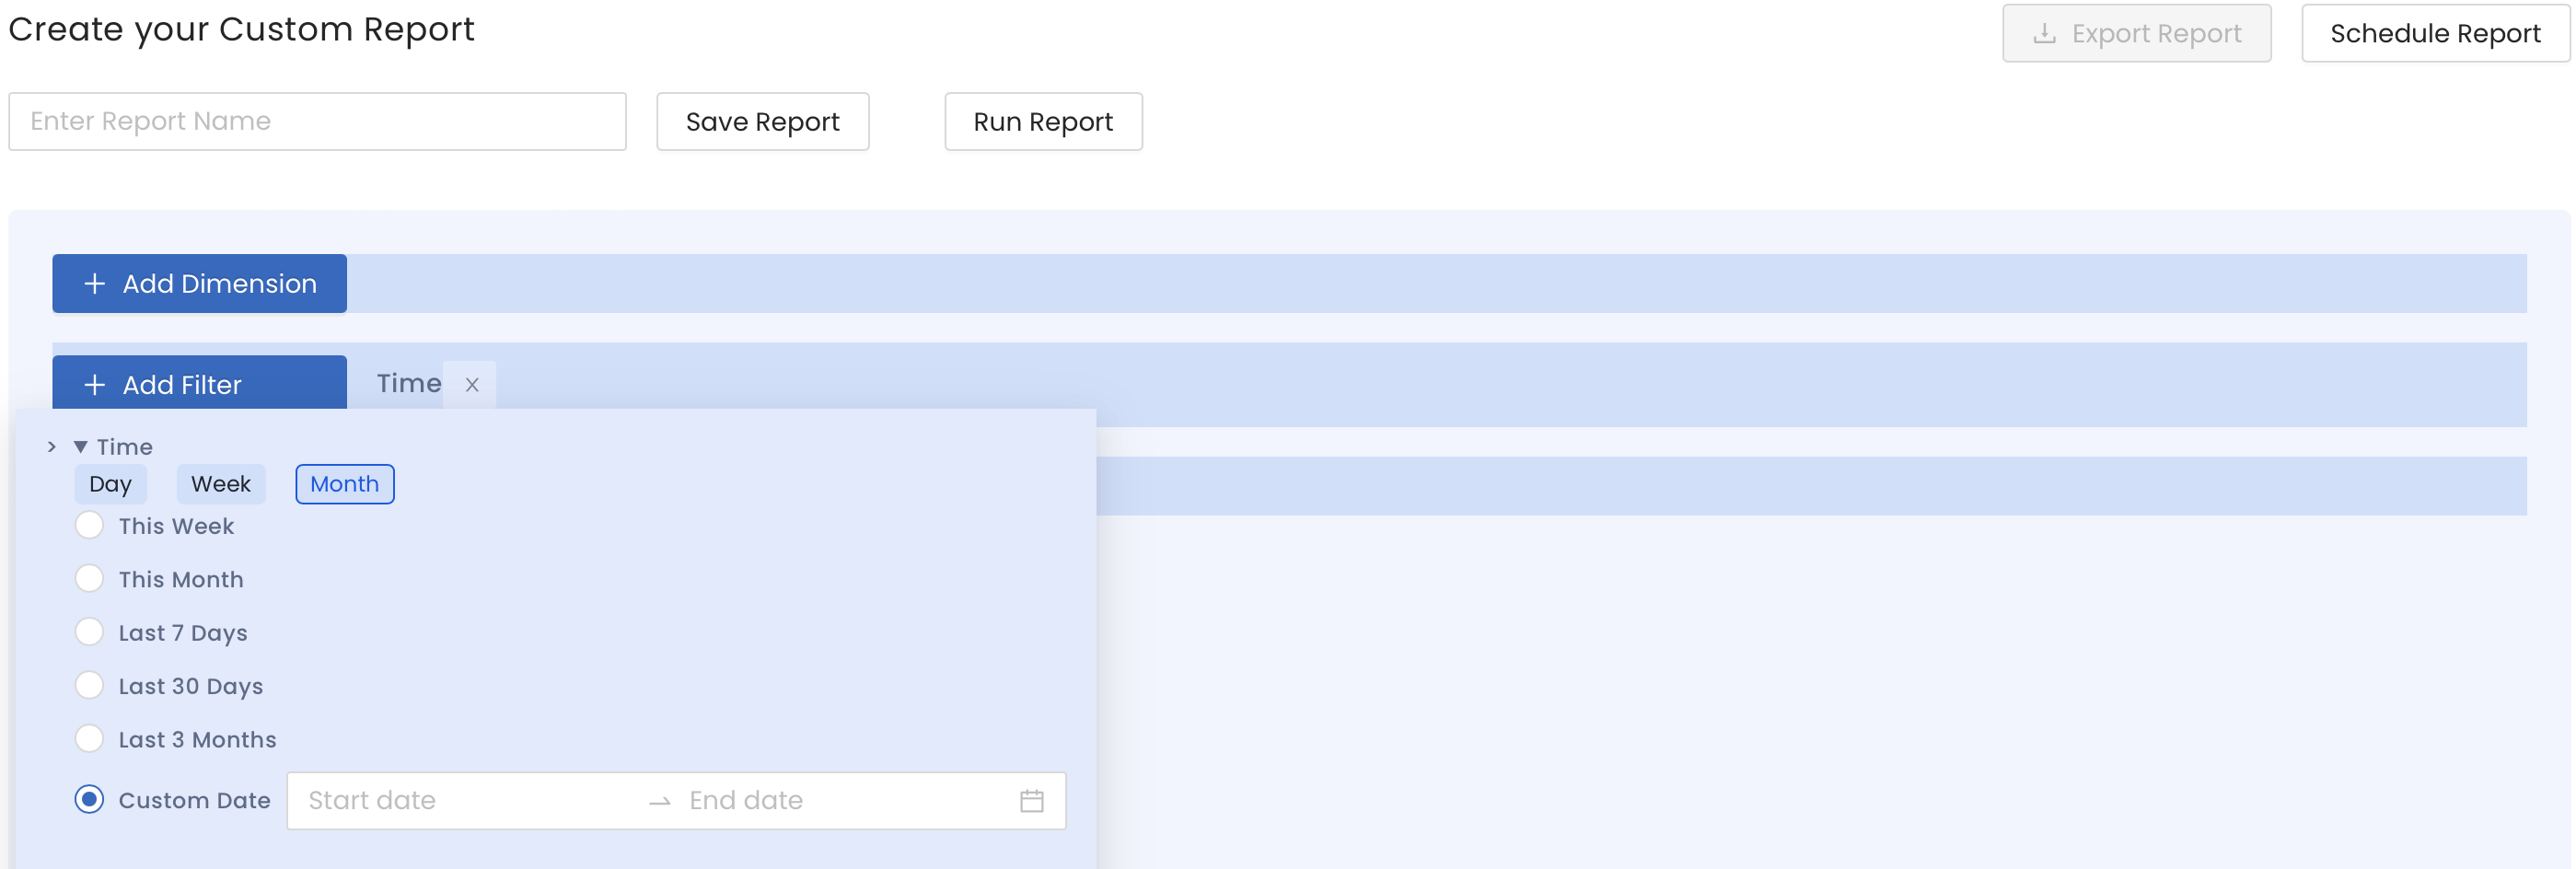
Filters allow you to query data only for specific values/attributes of the Dimensions.
You can choose from the following filters:
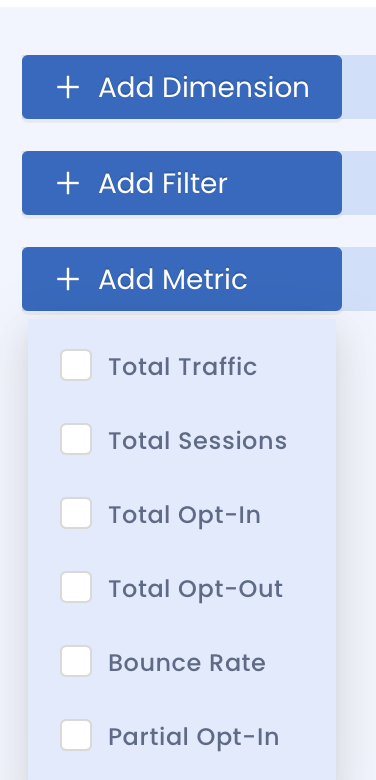
Metrics are the quantifiable measures that you wish to see. InMobi CMP offers the following metrics:
To understand better, let’s take an example. If you want to generate a report showing the opt-in rates of mobile devices in the USA in the last 30 days, it will look something like this.
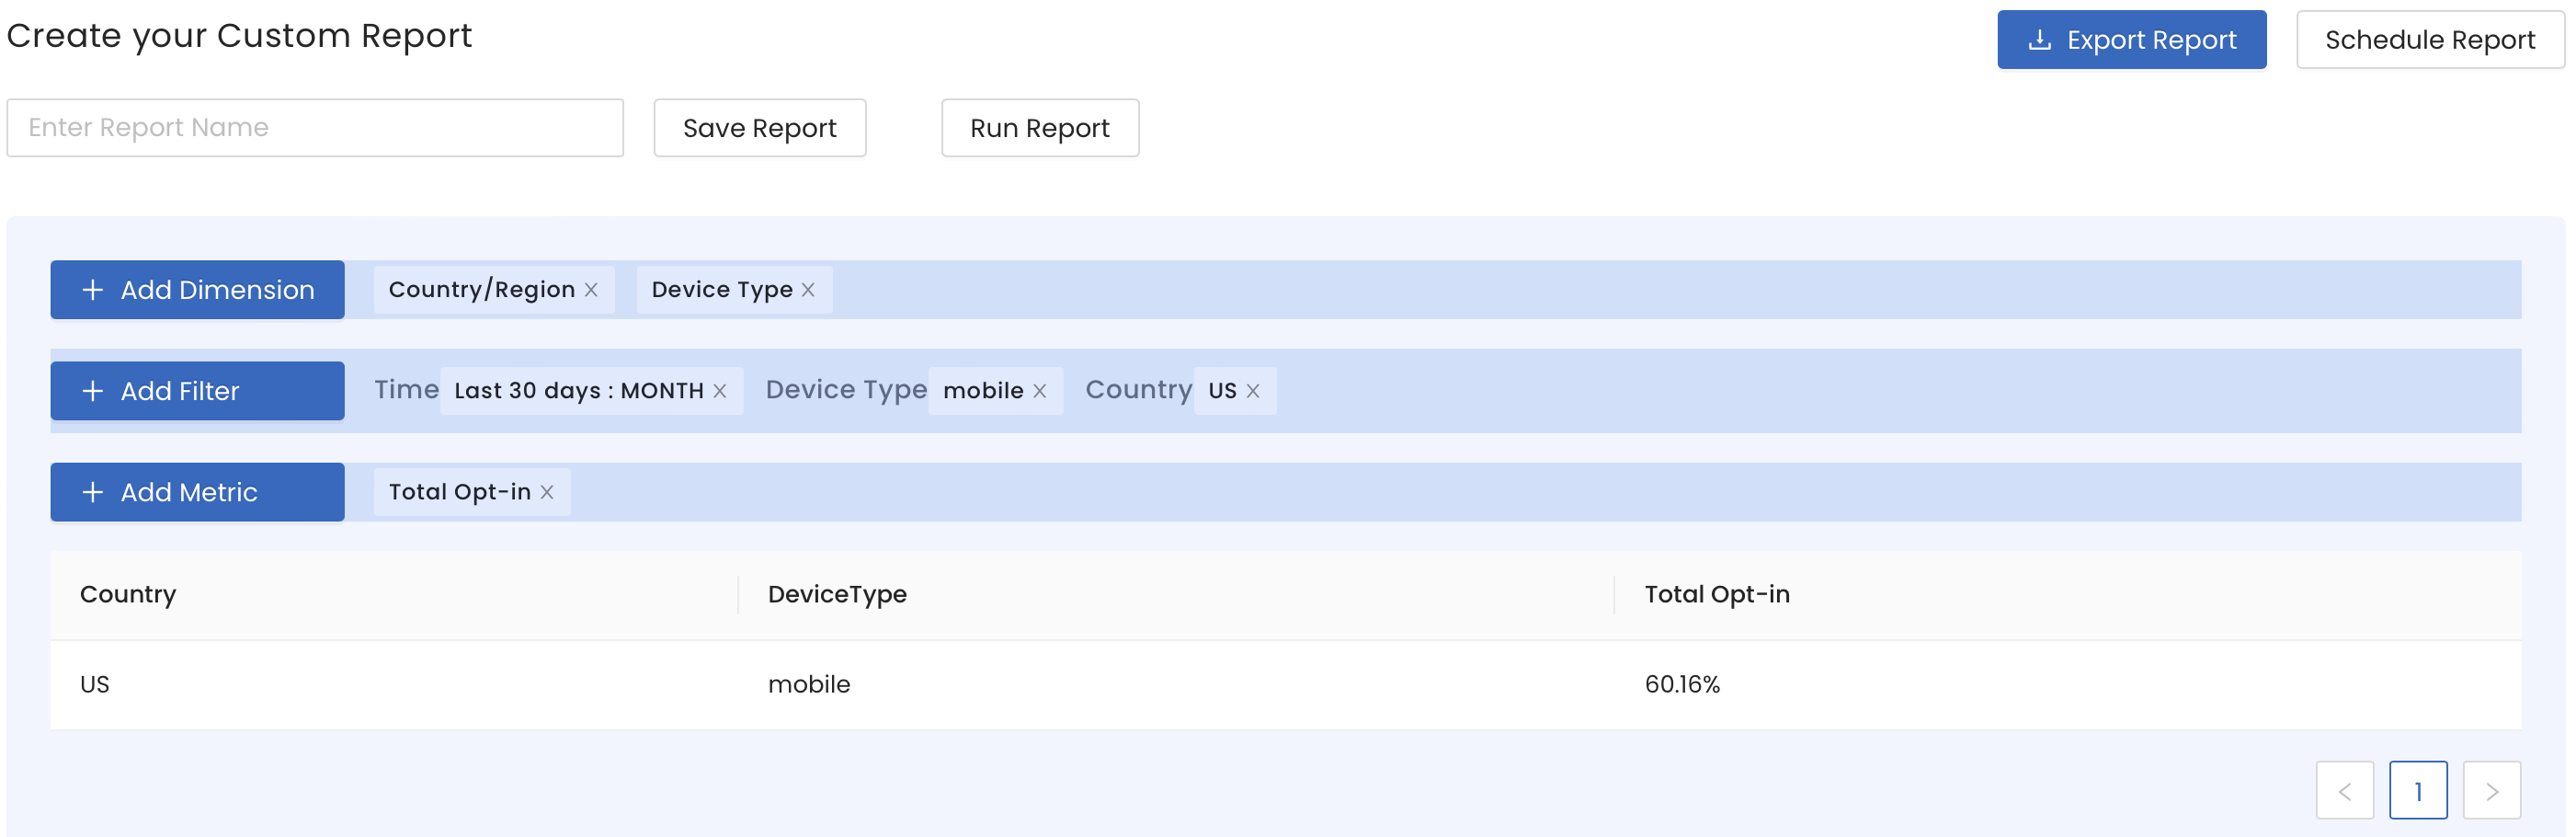
Here, Country and Device Type are the Dimensions, 30 days is the Time, Mobile is the Device Type filter, US is the Country filter, and opt-in rates is the metric.
You can view all your saved reports by clicking View All Reports.
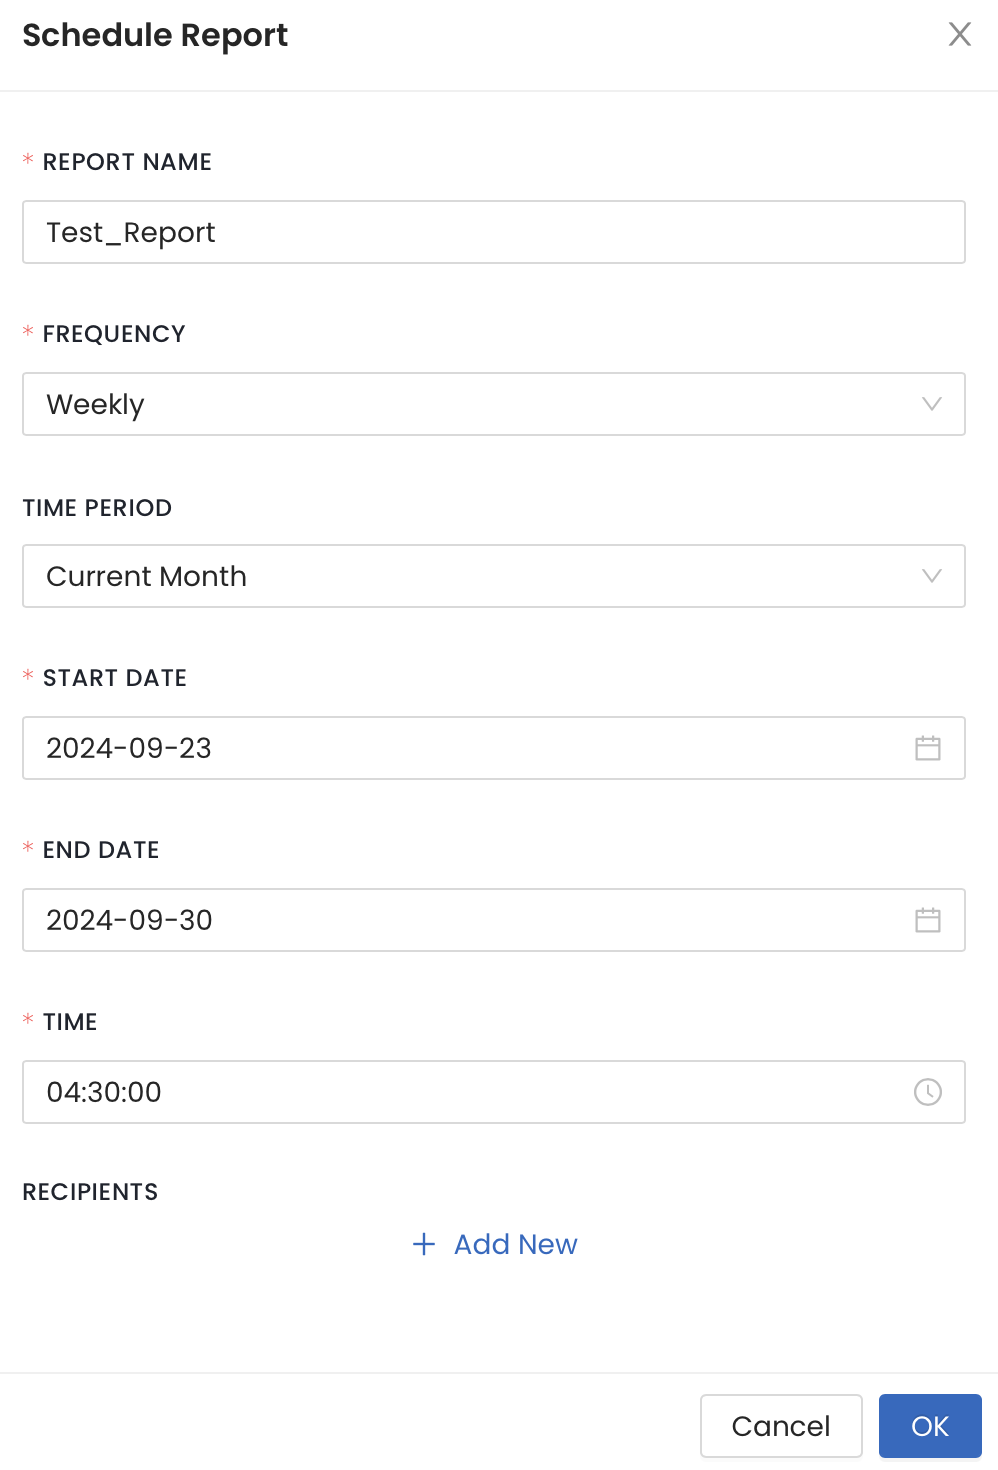
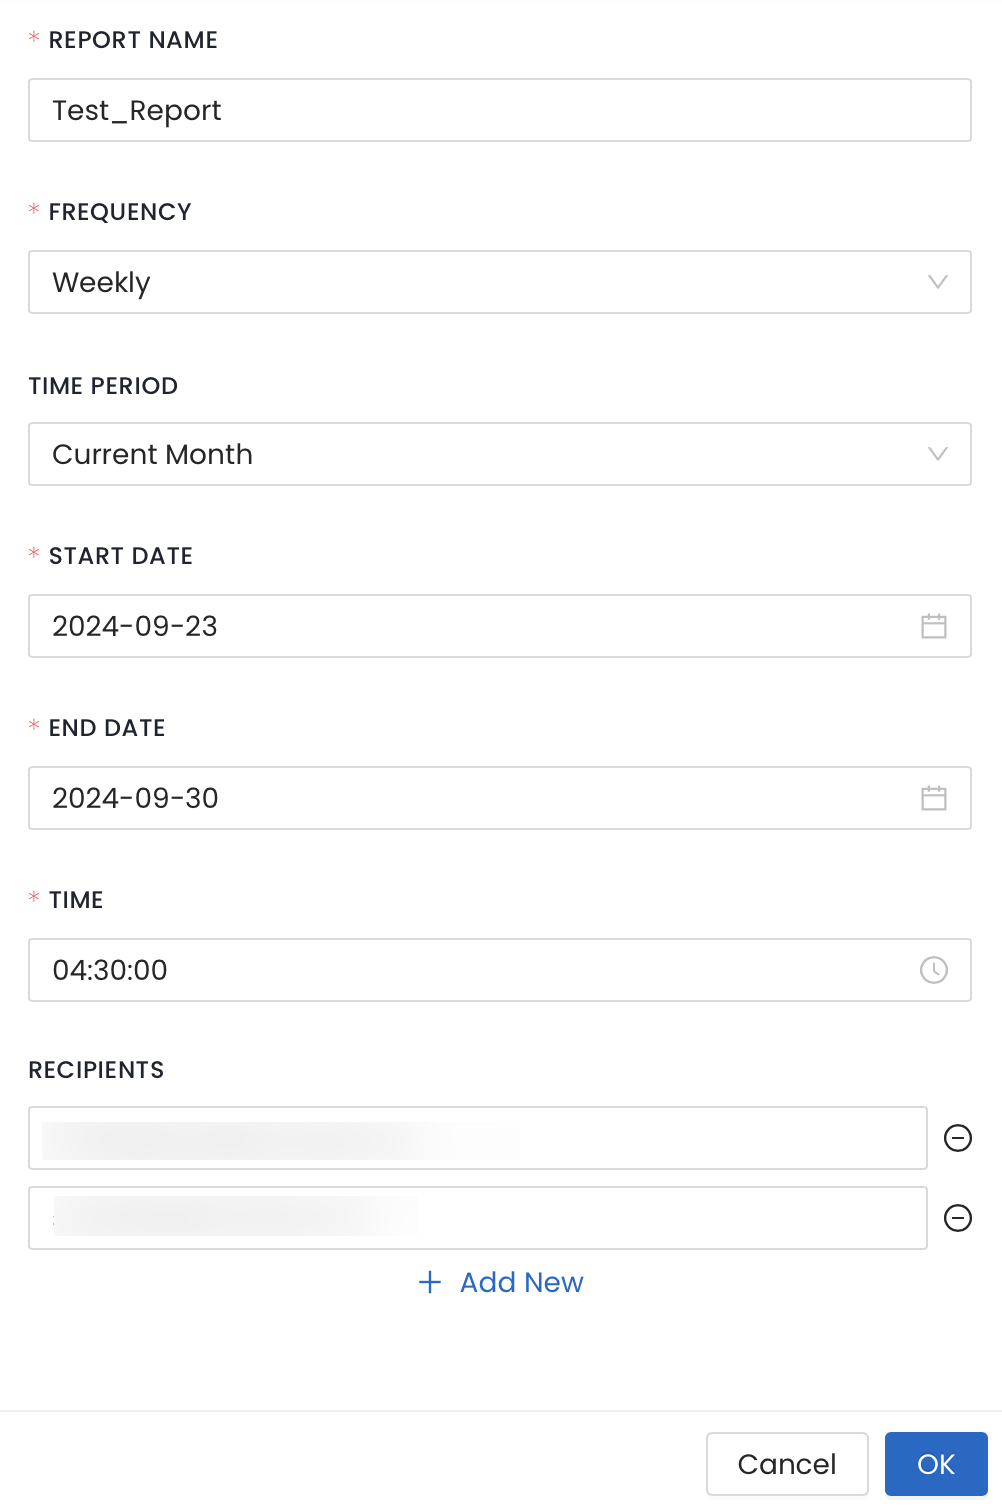
You can also schedule recurring reports. These will be automatically sent at regular intervals to specific email addresses listed by you. Currently, InMobi CMP can scheduled reports on a custom, daily, weekly, and monthly basis.
By installing this SDK update, you agree that your Children Privacy Compliance setting remains accurate or that you will update that setting, whenever there is a change in your app's audience. You may update the app's Children Privacy Compliance settings at https://publisher.inmobi.com/my-inventory/app-and-placements.
 Support Center


