InMobi performance reporting dashboard gives you a comprehensive view of your performance campaign on InMobi DSP. You can monitor your campaign performance using different combinations of metrics, countries, and media costs. You can also download overall and event-wise reports in CSV format. Any campaign event update takes 1 day to reflect on the Dashboard, and the updating happens in the UTC time zone.
Note:
For Japanese advertisers, the dashboard updates the Japan campaigns in the JST time zone. They can also switch between Dollars and Yen.

Pre-requisites
- You have an active campaign on InMobi DSP.
- You have received the invitation link from the InMobi team.
Access
You can create an account as follows:
- Click the Dashboard invitation link shared by the InMobi team to reach the login page.
- Click Login Now.
-
If you are logging in for the first time, enter the email ID you provided to the InMobi team. Click Next.
Note:
If you use a different email ID, you don’t receive any response after clicking Next.
- Enter your password.
- Click Log In. The Dashboard landing page opens with the list of the apps for which you have run a campaign on the DSP.
Notes:
- After you access the dashboard for the first time, you can browse https://dashboard.inmobi.com/ to open it.
- Use the Google Chrome browser for the best dashboard experience.
Generate reports
You can generate reports for past or existing campaigns as follows:
- Log in to your DSP Dashboard. You reach the Advertiser List page.

-
Search for the advertiser.
-
Click your app. You land on the Overview page.
Note:
The dashboard view is for Android Campaigns by default. If an advertiser is not running Android campaigns, the dashboard shows No Campaigns are Live on Android for this Advertisers. It shows a similar message if the advertiser does not have an iOS campaign.
- In the filters section, apply filters to generate the report accordingly.
- Select the campaign for which you want to view the performance report. You can select multiple campaigns.
- Select the data range for the report.
- Switch the toggle to Android and iOS based on the campaign’s target OS.
Notes:
For Japan,
- The toggle has Non-SKAN and SKAN options.
- You can switch the currency to Yen from Dollars.
- Click Apply Filter to see the intended report.
- You can find the following report views:
-
Performance: Generates a report by combining Campaign Name, Country, and Creative Type with Impressions, Clicks, and Installs. You can download the report in SVG, PNG, and CSV format by clicking —
—.
—
- Country Vs Install: Displays a pie chart showing the country-wise installs throughout the campaign. This is visible only for Android campaigns.
- Country Vs MMP Installs: Displays a pie chart showing the country-wise MMP installs throughout the campaign. This is visible only for iOS campaigns.
- Media Cost vs Campaign: Provides the billable cost of the campaign. You can download the report in SVG, PNG, and CSV format by clicking —
—
—
-
Overview report: Provides comprehensive data of all the performance metrics based on OS and Country. The available metrics are Clicks, Impressions, Media Cost, SKAN Installs (For iOS), MMP Installs (For iOS), Installs (For Android), CTR, eCPC, and eCPM.

-
Event report: Provides KPI events data, which helps to understand the campaign performance based on user events. The available columns are Campaign Name, Event Name, Country, OS, and Total Events (Number of times users complete an event).
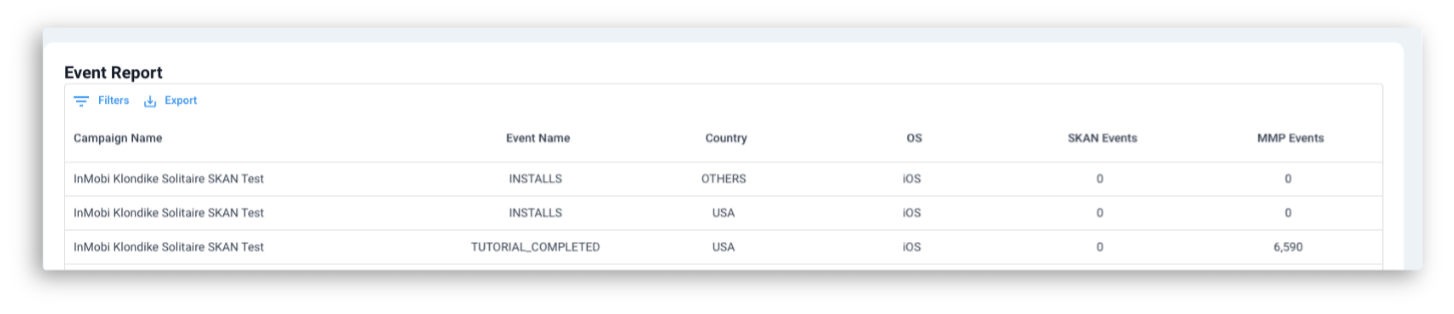
Note:
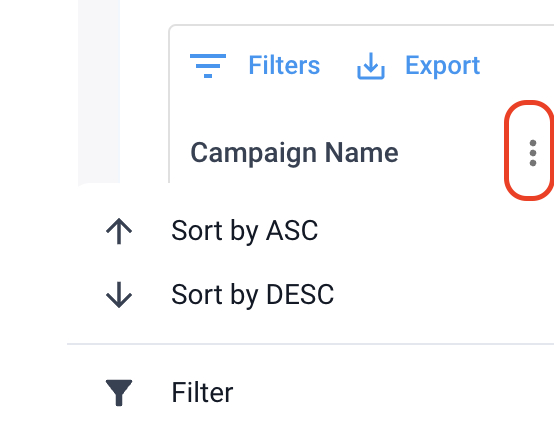
You can also sort and filter by clicking the ellipsis on the column header.

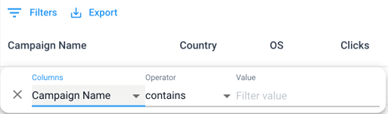
- You can filter the data by selecting the columns, applying operators, and entering a value, if any.
- You can export the data in CSV or PDF format by clicking Export.
Generate Publisher Report
Publisher report provides you with a list of the top publishers (a maximum of 500) of your campaign. These publishers are sorted based on the number of installs. You can see which app bundles (apps where DSP published the ads) give you the best performance and scale in a date range. You can work with the InMobi team to optimize your campaign based on the publisher data.
You can generate the Publisher Report as follows:
-
In the left menu bar, click Publisher App Report.

- In the filters section, apply filters to generate the report accordingly.
- Select the campaign for which you want to view the Publisher report. You can select multiple campaigns.
- Select the data range for the report.
- Switch the toggle to iOS or Android based on the inventory (OS) for the campaign.
Notes:
For Japan,
- The toggle has Non-SKAN and SKAN options.
- You can switch the currency to Yen from Dollars.
- Click Apply Filter to get the intended report.
-
The publishers' reports are segregated into the following columns: Campaign Name, App Bundle (refers to the publisher app), Country, OS, Clicks, Impressions, Media Cost, Installs, CTR, eCPM, and eCPC.

- You can filter the data by selecting the columns, applying operators, and entering a value, if any.
- You can export the data in CSV or PDF format by clicking Export.
-
You can also sort and filter by clicking the ellipsis on the column header.
Generate Creative Report
This report provides insights into the top-performing creatives for your campaign. These creatives are sorted based on the number of installs through their ad slots. You can view the creative type (creative formats such as Banner, Video, etc.) that gives the best perfrmance and scale in a date range. Work with the InMobi team to further optimize your campaigns based on the Creative report insights.
You can generate the Creative Report as follows:
-
In the left menu bar, click Creative Report.

- In the filters section, apply filters to generate the report accordingly.
- Select the campaign you want to see the performance for. You can add multiple campaigns.
- Select the data range for the report.
- Switch the toggle to iOS or Android based on the inventory (OS) for the campaign.
Note:
For Japan,
- The inventory toggle has Non-SKAN and SKAN options.
- You can switch the currency to Yen from Dollars.
- Click Apply Filter.
-
The publishers' reports are segregated into the following columns: Campaign Name, Creative Name, Creative Type, Country, OS, Clicks, Impressions, Media Cost, Installs, CTR, eCPM, and eCPC.

- You can filter the data by selecting the columns, applying operators, and entering a value, if any.
- You can export the data in CSV or PDF format by clicking Export.
-
You can also sort and filter by clicking the ellipsis on the column header.
Note:
Every time you change the filter values, click Apply Filter to bring the intended report.
Generate Raw Event Report
Raw Event Reports provide information on all the raw events in a live campaign. The raw events are the non-KPI events, which advertisers can refer to optimize their KPIs and understand user behavior.
You can generate the Raw Event Report as follows:
Note:
Every time you change the filter values, click Apply Filter to bring the intended report.
- In the left menu bar, click Raw Event Report.
- In the filters section, apply filters to generate the report accordingly.
- Select the campaign you want to see the performance for. You can add multiple campaigns.
- Select the data range for the report.
- Switch the toggle to iOS or Android based on the inventory (OS) for the campaign.
Notes:
For Japan,
- The toggle has Non-SKAN and SKAN options.
- You can switch the currency to Yen from Dollars.
- Click Apply Filter.
- The Raw event reports are segregated into the following columns: Campaign Name, Country, Raw Event Name, and Raw Attributed Events.

- You can filter the data by selecting the columns, applying operators, and entering a value, if any.
- You can export the data in CSV or PDF format by clicking Export.
- You can also sort and filter by clicking the ellipsis on the column header.
- You can also sort and filter by clicking the ellipsis on the column header.
Note:
Every time you change the filter values, click Apply Filter to bring the intended report.
Generate Week-on-Week (WoW) Report
Week-on-week (WoW) reports provide weekly insights into the campaigns. The weekly insights help you understand the campaign's current performance and if any strategy change is required to uplift the performance.
You get two types of WoW reports:
- Week-On-Week Detail Report: It has detailed numbers and an option to filter and export.

- Week-On-Week Overview: It has a graphical overview of the weekly campaign performance based on metrics such as Clicks, Installs, Impressions, and KPI Event Count.

You can generate the WoW report as follows:
- In the left menu bar, click WoW report.
- In the filters section, apply filters to create the report accordingly.
- Select the campaign for which you want to see the performance. You can add multiple campaigns.
- Select the quarter and the year for which you want the weekly report.
- Switch the toggle to iOS or Android based on the inventory (OS) for the campaign.
Note:
For Japan,
- The inventory toggle has Non-SKAN and SKAN options.
- You can switch the currency to Yen from dollars
- Click Apply Filter.
- The WoW reports are segregated into the following columns:
- For iOS and SKAN campaigns: Campaign Name, Country, Impression, Clicks, MMP Installs, SKAN Installs, MMP Events, Media Cost, OS, Week Number, and Year.
- For Android and Non-SKAN campaigns: Campaign Name, Country, Impression, Clicks, Installs, KPI Event Count, Media Cost, OS, Week Number, and Year.
- You can filter the data by selecting the columns, applying operators, and entering a value, if any.
- You can export the data in CSV or PDF format by clicking Export.
- You can also sort and filter by clicking the ellipsis on the column header.
Generate Day-on-Day (DoD) Report
Day-on-Day (DoD) reports provide daily insights into the campaigns. The daily insights help you understand the campaign's performance at a more granular level and adjust ad spending or strategy if required.
You can generate the DoD report as follows:
- In the left menu bar, click DoD Report.
- In the filters section, apply filters to create the report accordingly.
- Select the campaign for which you want to see the performance. You can add multiple campaigns.
- Select the date range for which you want the daily report.
- Switch the toggle to iOS or Android based on the inventory (OS) for the campaign.
Notes:
For Japan,
- The toggle has Non-SKAN and SKAN options.
- You can switch the currency to Yen from Dollars.
- Click Apply Filter.
- The DoD report are segregated into the following columns:
- For iOS and SKAN campaigns: Campaign Name, Date, Country, OS, Clicks, Impression, Media Cost($), MMP Installs, SKAN Installs, CTR, Total eCPE, Total eCPI, MMP MMP eCPI, SKAN eCPE, SKAN eCPI, eCPC, and eCPM.

- For Android and Non-SKAN campaigns: Campaign Name, Date, Country, OS, Clicks, Impression, Media Cost($), CTR, eCPC, eCPM, eCPE, and eCPI.

- You can filter the data by selecting the columns, applying operators, and entering a value, if any.
- You can export the data in CSV or PDF format by clicking Export.
- You can also sort and filter by clicking the ellipsis on the column header.
Note:
Every time you change the filter values, click Apply Filter to bring the intended report.
 Support Center


